Ed Note: all mentioning of the invasive species Phragmites australis should now be updated to indicate this species has been identified by DNA sampling as the Native Species Phragmites australis, subspecies americanus.
By Moralea Milne, Student # 9913797, ER 390, April 12, 2004
Abstract: Gooch Creek and associated ecosystems provides habitat for two provincially blue-listed species: coastal cutthroat trout (Oncorhynchus clarki clarki) and red-legged frog (Rana aurora) as well as three spine stickleback (Gasterosteus aculeatus). Gooch Creek and associated ecosystems were mapped using Global Positioning Systems technology. Studies using Streamkeepers, Wetlandkeepers, Urban Salmon Habitat Program and Proper Functioning Condition to assess Gooch Creek have found the cumulative effects of land conversion, land use, livestock usage, invasive species encroachment and roads practices have negatively effected the aquatic health this system. Water quality sampling was conducted every second week at six locations for dissolved oxygen, water temperature, total dissolved solids, pH and turbidity. Chemical analysis of soil and water was also performed. Gooch Creek was found to suffer from low dissolved oxygen, high water temperatures and fluctuating pH at some sites during the summer and turbidity was found to be a concern, especially in the spring. Fecal coliform counts were extremely high. Insufficient large woody debris (LWD) and boulders, low summer flows, siltation, lack of riparian vegetation and insufficient depth of riparian vegetation were found to be areas of concern. Removing culverts, dredging Ben Acre pond, fencing out livestock and using best management road practices are recommended ways of improving water quality. Adding LWD, fencing out livestock, planting native riparian vegetation and liaising with the local roads coordinator are recommended strategies to improve stream function and condition. Monitoring is proposed to assess changes over time, to provide data that can determine adaptive management strategies and to gauge the success of restoration projects. Monitoring subjects should include: continue, at least annually, a designated date for chemical water testing from site three; test the creek water at site three, for petro chemicals to give base line data; continue seasonal water sampling from site one (in the marsh), gee trap twice a year at designated times to ascertain continued fish prescence; conduct assessment of aquatic invertebrates at least once a year at a designated location and date, for use as biological indicators of creek health; undertake photopoint monitoring to track physical changes over time; inventory and assess invasive plant species encroachment and monitor Parker’s Pond for algal blooms. Projects completed include: redesign of the weir at Ben Acre pond to allow easier access to fish and planting of Hooker’s willow (Salix hookeriana), red alder (Alnus rubra) and trembling aspen (Populus tremuloides) to augment riparian species at one location. Table of Contents List of Tables 1. Reach Interpretation 13 2. Gee Trapping and Fish Observation 13 3. Bird Observations 14 4. Species Percent Cover of Marsh Plants 16 5. Water Sampling-Site 1 26 6. Water Sampling-Site 2 27 7. Water Sampling Site 3 28 8. Water Sampling-Site 4 29 9. Water Sampling-Site 5 30 10. Water Sampling Ste 6 31 11. USHP Data Interpretation 34 List of Figures 1. Climate Graph 6 2. Topographic Map of Watershed 8 3. Biogeoclimatic Zones of British Columbia 9 4. Map of Marsh Showing Transects 11 5. 1930 Photo of Ben Acre Marsh 15 6. 2004 Map of Ben Acre Marsh 16 7. Map of Plant Communities of Ben Acre Marsh 17 8. Salmon Habitat Inventory Map (SHIM) 18 9. Turbidity Chart 20 10. Water Temperature Chart 21 11. Dissolved Oxygen Chart 22 12. pH Chart 23 13. Total Dissolved Solids Chart 23 14. Photo of New Bridge 25 15. Photo of Clay Causeway 25 16. Photo of Redesigned Weir 36 List of Appendices 1. Soils, Upland 40, 41 2. Soils, Swamp 42, 43 3. Soils, Marsh 44, 45 4. Soil Analysis Swamp and Marsh 46 5. 1858 Map of Metchosin 47 6. Site Visits 47 7. Vegetation in Marsh 50 8. Marsh Transect 51 9. Shrub Vegetation at Marsh Edge 52 10. Vegetation in Swamp 52 11. Vegetation Surrounding Ben Acre Pond 52 12. USHP Table A 53 13. USHP Table B 54 14. PFC Reach One-front and back 56, 57 15. PFC Reach Two-front and back 58, 59 16. PFC Reach Three-front and back 60, 61 17. PFC Reach Four-front and back 62, 63 18. PFC Reach Five-front and back 64, 65 19. PFC Reach Six-front and back 66, 67 20. PFC Reach Seven-front and back 68, 69 21. PFC Reach Eight-front and back 70, 71 22. Air Photo 1926 72 23. Air Photo 1970 73 24. Fecal Coliform Testing (Winter, 2001)-Site 3 74 25. Fecal Coliform Testing (Summer, 2001)-Site 3 75 26. Chemical Water Analysis, Summer , 2001-Site 3 76 27. Chemical Water Analysis, Winter, 2001-Site 3 77 28. Nitrogen Levels in Water, August, 2001-Site 3 78 29. Nitrogen Levels in Water, December, 2001-Site 3 79 30. Soil Particle Size and Organic Content 80 31. Parker’s Pond Alkalinity Testing-Site 5 81 32. Jone’s Spring Fecal Coliform Levels-Site 6 82 33. Wetland Survey TR1-QU1 83 34. Wetland Survey TR1-QU2 84 35. Wetland Survey TR2-QU1 85 36. Wetland Survey TR2-QU2 86 37. Wetland Survey TR3-QU1 87 38. Wetland Survey TR3-QU2 88 1. Introduction a. Goals and Objectives 5 b. History 5 2. Study Area a. Description and Location 5 b. Landuse 5 c. Climate 6 d. Geology 6 e. Landforms i) Upland ii) Shoreline 6 f. Soils 7 g. Hydrology 7 h. Ecology 8 3. Methods a. Water Quality 9 b. Soils 9 c. Maps 10 d. Site Visits 10 e. Fish and Invertebrates 10 f. Birds 10 g. Vegetation 10 h. Creek and Marsh Mapping i. Urban Salmon Habitat Program 12 ii. Proper Functioning Condition 12 iii. Streamkeepers 12 iv. Wetlandkeepers 12 v. Salmon Habitat Inventory Mapping 12 4. Results a. Water Quality 13 b. Fish 14 c. Birds 14 d. Invertebrates 15 e. Vegetation 16 f. Creek mapping i. Urban Salmon Habitat Program 16 ii. Proper Functioning Condition 16 iii. Streamkeepers 17 iv. Wetlandkeepers 17 v. Salmon Habitat Inventory Mapping 18 5. Discussion 1.General 18 2. Water Quality 20 3. Reaches a. Beach 25 b. Marsh 25 c. Reach One 26 d. Reach Two 27 e. Reach Three 28 f. Reach Four 28 g. Reach Five 29 h. Reach Six 29 i. Reach Seven 30 j. Reach Eight 30 k. Reach Nine 30 l. Reach Ten 31 m. Reach Eleven 31 n. Above Reach Eleven 32 6. Recommendations a. Water quality 32 b. Beach 32 c. Marsh 32 d. Reach One 32 e. Reach two 32 f. Reach Three 32 g. Reach Four 32 h. Reach Five 33 i. Reach Six 33 j. Reach Seven 33 k. Reach Eight 33 l. Reach Nine 33 m. Reach Ten 33 n. Reach Eleven 34 o. Summary of Restoration Priorities 34 7. Monitoring 35 8. Projects Completed 36 9. Conclusion 36 10. References 37 11. Appendices 40 1. Introduction a. Goals and Objectives The long term goal of this project is the restoration of Gooch Creek and associated ecosystems to a state which would ensure the healthy existence of its native inhabitants. The short term goal is the education of the landowners of the properties through which the creek runs and is affected, to the value of these ecosystems. The following objectives contribute to this goal: to gather baseline data on the stream and marsh; to produce a map of the ecosystem; to identify areas in need of restoration; to raise landowners awareness of the value of the ecosystem and the creatures that inhabit it, especially the blue listed species: coastal cutthroat trout (Oncorhynchus clarki clarki) and red-legged frog (Rana aurora); to indicate ways in which landowners can repair and protect their riparian zones; and to initiate some restoration, within financial and landowner constraints. b. History There is evidence of prehistoric use of the Parry Bay area of Metchosin. Numerous cairns and middens are found in the area and the remains of a defensive site, considered to be “probably the best preserved trench and embankment on the island” (Kidd, 1959), is located near the end of Taylor Road (Keddie, 1997a), in this watershed. One midden at Ash Point in Pedder Bay in Metchosin has been dated to 1700 years ago (Keddie, 1997b). European settlement of Metchosin began around 1850 when the Kakyaaken or Ky-Aakan people received £43/6/8 (paid in blankets), relinquishing their rights to the land, through negotiations with (Sir) James Douglas. Much of Gooch Creek flows through Section 2 (320 acres), which was purchased from Edward Kitson by Sir James Douglas for use as a summer retreat and hunting lodge. This property was later bought and farmed by the Fisher family (Weir, 1983). Current property owners are long time residents with very low turnover of properties.
2. Study Area
a. Description and location
Gooch Creek and its watershed are located in the District of Metchosin on southeastern Vancouver Island in an area approximately bounded by the Juan de Fuca Strait, specifically Parry Bay; Rocky Point Road (Rd); Happy Valley Rd; Parry Rd and Taylor Rd. The majority of the creek flows through private properties from 4545-4659 William Head Road. Ministry of Water, Land and Air Protection (MWLAP) states the watershed code is 76800-20-11-150 PD325599, UTM Zone 10, Northing 53576000, Easting 460750. Gooch Creek is a small coastal stream and marsh within the agricultural land reserve that is home to two anadromous fish species: coastal cutthroat trout and threespine stickleback (Gasterosteus aculeatus). The stream has the unique history of intermittently opening to the Juan de Fuca Strait during the wet winter season and losing this access from late spring till fall. The brackish marsh, which is located at the lowest point of the watershed and through which Gooch Creek runs is infrequently flooded with saltwater, in particular during winter extreme high tide and storm events and it is subjected to periodic freshwater flooding throughout the fall and winter.
b. Landuse
Landuse is rural-residential and agricultural. All properties have acreage and many properties are “hobby” farms with horses. There is one farm commercially producing hay and sheep and several farms with small scale commercial fruit and vegetable production. Metchosin town centre, involving a machine repair business, restaurant, general store, firehall, municipal hall, community hall and recently vacated elementary school and garage impact this watershed. Unfortunately, there is no information on the disposal system that flows from the town centre into the ditch along William Head Road, leading to Gooch Creek. The roads coordinator for the district has not been able to unravel the intricacies of the waste disposal systems in this area (Wong, pers. comm., 2003). There are concerns about potential toxic wastes from some of these locations.
c. Climate
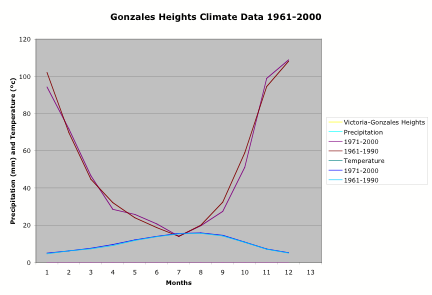 This is considered to be a “Mediterranean” type climate with cool, wet winters and moisture deficit conditions in summer (Environment Canada, 2003). With climate change prognostications these seasonal differences could even more pronounced (Hebda, 1996). The Parry Bay area of Metchosin has drier weather conditions, similar to Gonzales Hill weather station in Victoria, than the higher precipitation experienced at Victoria airport weather station. Figure 1
d. Geology
Bedrock is composed of Metchosin Volcanics from the Carboniferous and Devonian eras. During the later Jurassic period the landscape was partly replaced by batholithic intrusions. Millions of years of erosion reduced this to lowland. Glaciation occurred three to four times during the last one million year period known as the Pleistocene era. During the Vashon ice advance of 10,000-15,000 years ago (Edwards, 1967), the weight of the ice submerged this area under 150-300 metres of seawater (Yorath and Nasmith, 1995). As the ice retreated, the land gradually rose to its present level, with soils developing from morainal and marine deposits (Edwards, 1967)
e. Landforms (upland and shoreline)
i. Upland Landforms of the lower watershed include a gently sloping topography with a stream cut valley ending in a brackish marsh with a barrier berm or barrisway, which seasonally opens to Parry Bay. There are forested areas with second growth conifers, fragments of Garry oak woodlands and tableland converted to agricultural use. The upper watershed was originally forested hillsides with wetlands in low lying pockets, this has been converted to rural residential use with (generally) 2-10 acre properties. ii. Shoreline characteristics Wolf Bauer (1976) describes the Parry Bay Drift Sector (3.38 km) as an integrated erosion-transport-accretion beach system. From the southern end by a rocky promontory for approximately 274 metres (m) is a Class I beach of sand and gravel with a moderately steep foreshore and broad, stable berm partly covered by trees and dune grass, considered a near-neutral drift zone. From Sherwood Pond to 402 m past Taylor Road, is a Class II sector beach (less stable and wet during extreme high tides) located in front of a slowly receding low-bank terrace, except for a low backshore berm, occasionally breached by Gooch Creek. While drift is multi-directional, net drift is northward. Drift belt in the upper foreshore is heavy and tends to keep bank erosion to a low recession rate. Just past Gooch Creek begins a Class III beach (beach less stable and wet during high tides) and high bluffs which are slowly eroding, providing sand to Witty’s Lagoon. The creek is only periodically (October-May) open to Parry Bay, limiting access of the anadromous cutthroat trout and sticklebacks. Generally the beach berm, which prevents access to Parry Bay, can only be breached during the winter wet season. The berm restricts the creek to underground seepage through the beach sands into Parry Bay until the rains have contributed enough water to flood the marsh, providing sufficient pressure to breach the berm.
f. Soils
Upland soils are considered to be site series BG (Douglas fir, grand fir-Oregon grape), previously considered site series 04 FdBg-Oregon grape (appendice 1, 2, 3). On July 11, 2003, a soil sample was taken from the marsh to a depth of 2 metres. The soil was estimated to be 4-5, using the Von Post scale and it appeared to remain the same throughout the sample. At approximately 70 cm, there was a piece of burnt wood. Overall, the soil was wet and mushy, with a consistent degree of semi-decomposition throughout, indicative of many years as a sedge marsh. Soil samples were taken from the marsh and swamp and sent to MB Labs for analysis. These indicate a pH of 5.92 (marsh) and 6.19 (swamp), organic matter of (marsh) 35.5% and (swamp)12.7%. Sodium levels in the marsh were 7578 ug/g versus 600 ug/g in the swamp, which confirms periodic saltwater incursion into the marsh (appendice 4).
g. Hydrology
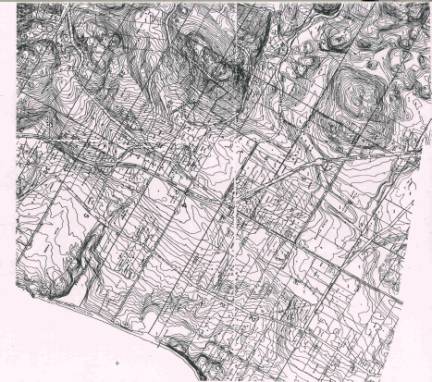
Figure 2. Topographic Map of Gooch Creek Watershed
The apex of the groundwater system is an area fed by adjoining hills in a converted wetland bounded by Arden Road and Herilhy Place. This area drains approximately northeast, feeding the Gooch Creek watershed. The main drainage system is subsurface in the summer until it becomes Jones Spring at 4546 William Head Rd. The spring appears to have been modified and bermed. As Jones Brook it is then ditched through this property, crosses William Head Rd through a culvert and begins year round flow through 4545 William Head Rd. This flow is supplemented by surface and subsurface runoff from ditches and properties along William Head Rd. from the town centre and from properties to the south. Gooch Creek once flowed overland from a spring fed pond on Parry X Road. It has been culverted and is only visible as surface flow through some yards in the winter months. The Jones Brook tributary enters Gooch Creek at (approximately) 4536 Parry X Road. The creek and marsh are also fed by groundwater and stormwater from properties along Taylor Rd and William Head Rd An additional vernal wetland and creek system flow through 4596 William Head Rd. When it reaches William Head Road it joins a ditch which steers the water to a culvert that runs under the road and exits onto 4565 William Head Rd (Plaxton property). As Gooch Creek reaches its lowest elevation it flows through an alder/skunk cabbage swamp, through a large constructed pond on the Ben Acre property, through further alder/skunk cabbage swamp and into a brackish sedge marsh, before exiting into Parry Bay
h. Ecology
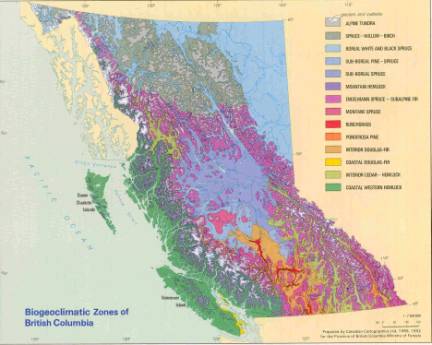
Figure 3. Biogeoclimatic Zones of British Columbia
Metchosin is located within the Coastal Douglas-Fir biogeoclimatic zone, moist maritime subzone (CDFmm) (Meidinger and Pojar, 1991). The lower regions of this watershed comprise part of the range of the threatened Garry oak ecosystem, considered by some a more xeric subzone than is indicated by the BEC classification. For the purpose of this report I have identified the marsh as CDFmmTmPa (SFTEMIBC, 1998). Triglochin maritimum (Tm) and Potentilla anserina ssp. pacifica (Pa) can be indicative of brackish wetlands (Pojar and MacKinnon, 1994)
3. Methods
- Water Quality
Water quality was assessed at six sites by sampling approximately every second week for: dissolved oxygen (DO2) content as 0.1mg/l and expressed as mg/l [ppm]), total dissolved solids (TDS) in mg/l, turbidity as Jackson Turbidity Units (JTU’s) which are equivalent to Nephelometer Turbidity Units (NTU’s), pH, air and water temperature. Separate chemical analysis of water samples was conducted by MB Labs of Sidney, BC. Site one was located at the bridge in the marsh in reach one. Site two was at the weir in the Ben Acre constructed pond. Site three was located at the beginning of reach four at the base of a large boulder. Site 4 was located on the Plaxton property, downstream of the entrance of the stormwater ditch from William Head Rd. Site five was from the float on the Parker pond and site six was Jone’s Spring. Water quality criteria for salmonids was evaluated, in part, according to parameters which are applied to fish hatcheries (Sigma Resource Consultants, 1979) as data for free ranging sea-run cutthroat trout was difficult to find.
- Soils
Terrestrial ecosytem mapping was completed according to Standards forTerrestrial Ecosystem Mapping (SFTEMIBC, 1998), which included soil pits in the upland, swamp and marsh. Marsh soils were also examined with the use of a Hiller sidewall corer and a chemical soil analysis was completed on both marsh and swamp soil samples by MB Labs of Sidney, BC.
- Maps
Airphoto maps were complied from federal, provincial and municipal government sources and from University of Victoria. Topographical maps were copied from the District of Metchosin maps. 1:20,000 TRIM map No. 92B.033 was produced in 1993 for the former Ministry of Environment, Lands and Parks. The 1858 map of District of Metchosin was discovered at the Plans Vault, Archaeology and Registry Services Branch (appendice 5). d. Site Visits
See appendice 6
- Fish and Invertebrates
Fish presence was validated with gee trapping, according to Streamkeepers criteria. Fish abundance was not surveyed, as electrofishing methods were considered potentially damaging to aquatic populations. Invertebrate sampling was conducted as part of Streamkeepers assessment.
- Bird
Bird presence was surveyed by observation
- Vegetation
Vegetation was mapped in conjunction with Urban Salmon Habitat Program (USHP) and Wetlandkeepers assessments. Three methods were used to inventory plants within the marsh. One method entailed walking through the marsh and estimating species presence and abundance. The second method involved estimating species abundance along a transect which traversed the length of the marsh and the third method required more detailed assessment of plant species cover of six one square metre plots, distributed throughout the marsh according to Wetlandkeepers criteria.
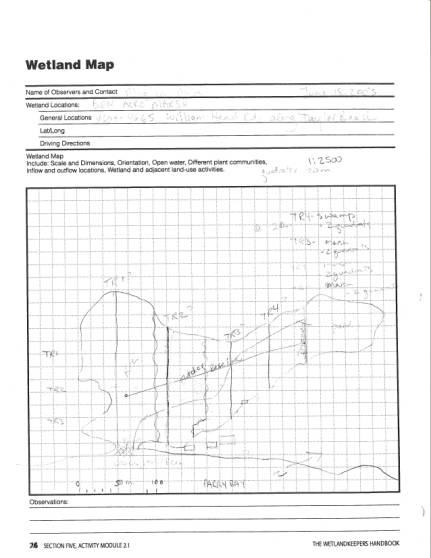
Figure 4. Map of Marsh Showing Transects
- Creek and Marsh Mapping
Mapping of Gooch Creek was accomplished using several different techniques. The first mapping occurred in 2000 using Steamkeeper methods, one section of reach three was mapped as a reference section. The second mapping occurred on July 31st and August 9th 2001 following the proscribed methods of the USHP with Lew Carswell as their representative and finally the creek was mapped using Proper Functioning Condition (PFC) assessment with Patrick Lucey and Lehna Malmquist on May 20th and 23rd, 2003. GPS mapping was conducted with Springfield Harrison of Stellar GPS and Mapping of Sidney, BC. The marsh was mapped following Wetlandkeepers criteria in the spring of 2003. i. Urban Salmon Habitat Program (USHP) The USHP was developed to focus on salmon species and salmonid habitat in urban areas and data interpretation is based on using salmonids as a keystone species; if the ecosystem functions well for salmonids, it has a quality of characteristics which provide a healthy community for its other inhabitants. Stream assessments include measuring: water quality; channel structure, characteristics and processes; bank stability, amount of LWD and other cover, adjacent landuse, fish abundance and vegetation. No electrofishing was attempted, as it was considered potentially damaging to aquatic life, therefore there is only an indication of fish presence, not abundance. Assessments are transferred to a computer program, which evaluate the data and judge stream health, indicating areas of concern (Michalski et al, 2000). ii Proper Functioning Condition (PFC) The National Riparian Service Team (2004) describes PFC as a “methodology for assessing the physical functioning of riparian and wetland areas. The term PFC is used to describe both the assessment process, and a defined, on-the-ground condition of a riparian-wetland area. In either case, PFC defines a minimum or starting point”. Twenty questions on hydrology, vegetation and soil-erosion-deposition are answered in a yes/no/na fashion by an interdisciplinary team to ascertain functioning condition of an aquatic ecosystem (Prichard et al, 1998), on which people can then place value judgments. For example, giving high fish production a top priority means managing the riparian environment so that it maintains an intermediate, arrested successional pattern. High fish production needs a large, steady supply of food and high water quality, characteristics of an intermediate stage in succession. “Old growth” characteristics provide clean water but less streamside vegetation, thus less food for fish, invertebrates etc. iii Streamkeepers Streamkeepers is a program for volunteers to assess stream health by collecting and interpreting data on water quality, channel characteristics, stream discharge, streambed composition, bank stability and vegetation. These parameters are graphed to produce a value index of the stream (Taccongna and Munro, 1995). However the invertebrate surveys and gee trapping were the only parts of the Streamkeeper assessment that was accomplished. Invertebrate surveys were recorded with Susan Low (formerly) of Streamkeepers as an alternate means to monitor ecosystem health. The proportion of water quality sensitive invertebrates such as caddisflies (order Trichoptera), stoneflies (order Plecoptera) and mayflies (order Ephemeroptera), invertebrates that are particularly sensitive to water quality indicate stream health (AERABI, 2000). iv. Wetlandkeepers Wetlandkeepers program consists of inventories of plant and bird species (Southam and Curran, eds., 1996). There is no mechanism embedded in the program to determine wetland health from these inventories. Three transects were laid out which included two quadrats of one square metre for each transect. These were inventoried for plant species. v. Salmon Habitat Inventory Mapping (SHIM) SHIM mapping “provides reliable, current, and spatially accurate information about local fish and wildlife habitats” (SHIM website: www.shim.bc.ca/what.html.2004) and is meant to produce a digital map of a stream, incorporating the GPS co-ordinates as well the usual assessment parameters onto a map available online. GPS mapping occurred over two days in 2002 and produced a map of the ecosystem which incorporated some SHIM data. Unfortunately there was not enough expertise available at that time to realize the full complement of SHIM parameters. 4. Results
*Note on different interpretations of reach: Using different models, such as USHP and PFC to map and assess Gooch Creek and my own inexperience, has led to the use of different criteria to describe a reach. In the interests of clarity, reaches will be described as defined by USHP. Where pertinent, the compatible PFC reach numbers will be used. Table 1. Reach Interpretation
| USHP | PFC |
| 1 | 1,2 |
| 2 | 3 |
| 3 | 4 |
| 4 | 5 |
| 5 | 5 |
| 6 | 5 |
| 7 | 5 |
| 8 | 5 |
| 9 | n/a |
| 10 | 6, 7 |
| 11 | 8 |
a. Water Quality Testing Results See graphs under discussions
- High temperatures were experienced at sites one and five.
- DO2 was critically low at sites one, two and six
- Turbidity was a concern at all sites except site five at some point in the year, generally throughout the spring, after heavy rains.
- PH was found to be slightly above neutral at all sites except sites one and five.
- TDS readings were within acceptable parameters and also indicate periodic flooding of saltwater into Ben Acre marsh, a natural and historic occurrence.
b. Fish
Table 2. Gee Tapping and Fish Observation Fish Presence/Absence Date Cutthroat Trout Threespine Stickleback Comments
| Oct 26, 2000 | 2 | 3 | Gee trapping |
| Aug 15, 2001 | 0 | 0 | Gee trapping |
| Sept 17 | 4 | Gee trapping | |
| Sept 18 | 2 | 2 | Gee trapping |
| Oct 15 | 0 | 0 | |
| Feb 1, 2002 | 10 | Gee trapping/no fish Small trout seen around redds (15-20 cm) | |
| Feb 9 | 2 | 2 (15-20 cm) trout seen | |
| Feb 12 | 1 | Trout seen | |
| Feb 24 | 1 | Trout jumping | |
| Feb 26 | 7 | Trout spawning, 2 lg 40- 60 cm, sea-run | |
| March 12 | 2 | Lg trout (sea run size) | |
| May 17 | 1 | Trout in weir, went Downstream (to outlet?) | |
| June 4 | 10-20 | Fry found at various locations . Possible fish jumping at Parker’s Pond (Rainbow?) | |
| June 12 | 3 | Gee trapping Fish jumping at Parker’s | |
| June 13 | 1 | 2 | Gee trapping |
| July 4 | 1 | Seen downstream of weir | |
| Oct 24 | 3 | ||
| Jan 8, 2003 | No trout spawning yet | ||
| Feb 17 | 2 | 40 cm and 15 cm | |
| July 11 | 0 | 0 | Gee trapping |
c. Table 3. Bird Observations from 2000
| Common name | Latin name |
Comments/Habitats |
| Virginia rail |
Rallus limicola |
Heard and saw in marsh |
| Common snipe | Gallinago gallinago | Marsh |
| Mallards | Anas platyrhynchos | Marsh, creek, pond |
| Marsh wren | Cistothorus palustris | Marsh, several |
| Lincoln sparrow | Melospiza lincolnii | Marsh, saw flock twice |
| Red-winged blackbirds | Agelaius phoeniceus | Marsh, saw flock once |
| Pileated woodpecker | Drocopus pileatus | Swamp |
| Northern flicker | Colaptes auratus | Orchard |
| Hairy woodpecker | Picoides villosus | Swamp |
| Downy woodpecker | Picoides pubescens | Swamp, marsh-edge thickets |
| Winter wren | Troglodytes troglodytes | Swamp, marsh-edge thickets |
| Stellar’s jay | Cyanocitta stelleri | Swamp and forests |
| Fox sparrow | Passerella iliaca | Marsh-edge thickets |
| Song sparrow | Melospiza melodia | Marsh-edge thickets |
| Yellow warbler | Dendroica petehia | Thickets, brambles |
| Warbling vireo | Vireo gilvus | Marsh-edge thickets |
| Golden-crowned sparrow | Zonotrichia atricapilla | Grassland |
| White-crowned sparrow | Zonotrichia leucophrys | Grassland |
| American robin | Turdus migratorius | Orchard |
| Chestnut-backed chickadee | Parus rufescens | Marsh-edge thickets |
| Golden-crowned kinglet | Regulus satrapa | Marsh-edge thickets |
| Ruby-crowned kinglet | Regulus calendula | Marsh-edge thickets |
| Brown creeper | Certhia americana | Upland |
| Bushtit | Psaltriparus minimus | Upland |
| Red-tailed hawk | Buteo jamaicensis | Overhead |
| Bald eagle | Haliaeetus leucoecphalus | Nests in forest |
| Northwest crow | Corvus caurinus | Overhead |
| Common raven | Corvus corax | Overhead |
| Hawk sp. Cooper or sharp-tailed | Acipiter sp. | Overhead |
| Great blue heron | Ardea herodias | Overhead, on beach |
| Turkey vulture | Cathartes aura | Overhead |
d. Invertebrate
Invertebrate sampling showed poor species diversity and very few of the sensitive species such as caddisflies, stoneflies and mayflies, whose low presence/absence indicate poor water quality. e. Vegetation See appendices 7, 8, 9, 10, 11 for vegetation surveys Unfortunately, the research conducted during this project focused heavily on fish habitat and reliable data was not collected on invasive species. However, some early data collection indicates the presence of invasive species and personal observation indicates an increase in the abundance of the following introduced and problematic species: Himalayan blackberry (Rubus discolor) in upland, gorse (Ulex europaeus) in upland and swamp edge, daphne (Daphne laureola) in upland forests, ivy (Hedera spp.) in forest and riparian, holly (Ilex spp.) in swamp and riparian, *common reed (Phragmites australis) in marsh, reed canary grass (Phalaris arundinacea) in marsh Common reed has established itself as evidenced by comparing past and present photos of the marsh.
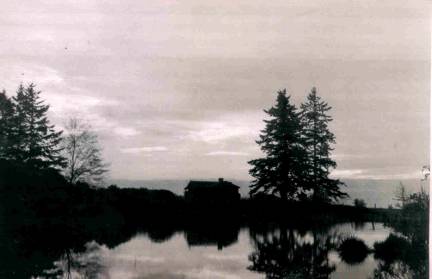 Figure 5. Ben Acre marsh 1930’s
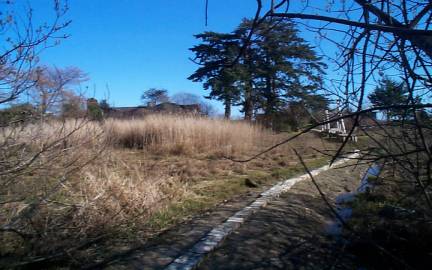
Phragmites australis Subspecies americanus , Now identified by DNA as the the native species of Phragmites
Figure 6. Ben Acre marsh March 2004 Notice the *Phragmites australis evident in the centre of this photo
Table 4. Species Percent Cover of Marsh Plants Using Three Methods
Plant Species |
Guesstimate |
Transect |
Plot |
Triglochlin maritimum |
60 |
30 |
10 |
| Potentilla anserina |
5 |
8 |
15 |
| Carex lyngbyi |
13 |
20 |
3 |
| Carex obnupta |
7 |
7 |
3 |
| Phragmites australis |
3 |
0 |
3 |
| Typha latifolia |
5 |
8 |
0 |
| Misc. grass sp |
8 |
8 |
8 |
All other plant species were only recorded as trace abundance g. Creek mapping i. USHP With USHP assessment, highest ratings are assigned to areas of most concern. Overall evaluation indicates that off-channel habitat is the highest concern (30), followed closely by lack of LWD (28), lack of boulder cover (28), % wetted area or summer lows (26), % fines or siltation (22), lack of cover in pool (20), lack of vegetation depth (20) and % crown cover (16) (see appendices 11 and 12). ii. PDF PDF assessment indicates Proper Functioning Condition of all areas except reaches six and seven, which are deemed non-functioning. Common concerns are lack of large woody debris, the restriction of sediment movement into the marsh by the dam/driveway, restriction of water flow by the logjam at the beach outlet, some trees should be pulled over to allow light penetration. Reach six and seven have no riparian vegetation and evidence downcutting and reach seven suffers from livestock ranging in the creek and riparian area causing hummocking, erosion and downcutting. Invasive species are a concern in most reaches (appendices 14 [front and back] to 21 [front and back]). iii. Streamkeepers Invertebrate surveys show extremely poor water quality for invertebrate health. There were very few of the sensitive invertebrates, although there were many amphipods. The score was extremely low. Unfortunately these surveys were misplaced when sent to “Staples” for scanning, so they cannot be part of the appendices. iv. Wetlandkeepers
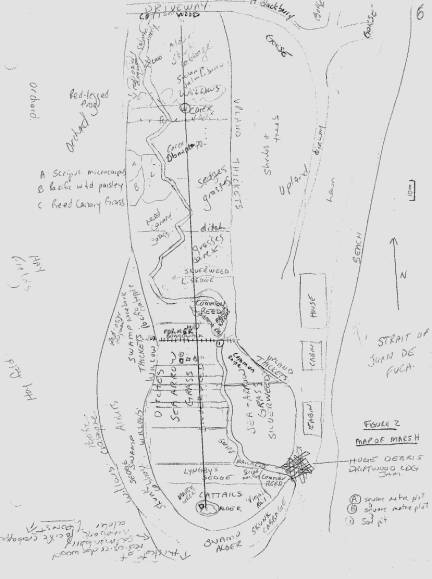 Figure 7. Plant Communities of Ben Acre Marsh
Wetlankeepers inventory showed the presence of reed grass, reed canary grass and ditching v. SHIM
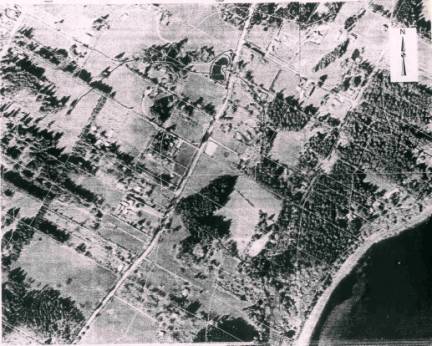
Figure 8. SHIM Map of Gooch Creek Part of marsh is missing due to poor quality of map photo.
5. Discussion
General
Gooch creek and its associated ecosystems have been subjected to many changes and pressures since pre-European contact. Analysis of air photos from 1926, 1970 and 2001 (appendices 22, 23, 24) show a decrease in forest cover in the upper reaches of the watershed, although the lower reaches have remained fairly stable. Conversion of this landscape to rural residential and farm use has initiated many changes. The original hydrologic regime, in which seasonal and permanent wetlands fed the surface and sub-surface water flow, has been altered by drainage ditches, roads, driveways, impermeable surfaces, culverts, wells, constructed ponds, logging, land-use conversion, housing and livestock use. Summer lows are a normal part of the hydrology that are exacerbated by a variety of factors, including conversion of forested land, increased rural residential density and the attendant use of wells and the perceived global climate change with the general trend to warmer, drier weather (Hebda, 1996). The Arden Road subdivision, near the apex of the watershed, has just received approval and financing to hook up to the Capital Regional District (CRD) Water system. Hopefully this will reduce the use of well water and restore some degree of natural groundwater flow to the Gooch Creek water system. Coupled with this are the reduction of wetlands and native groundcover that further reduces the ability of the landscape to retain the winter precipitation. A cascading series of negative reactions begin when people have not recognized the significance of vernal wetlands, creeks and pools and have developed their properties without regard for their hydrological regimes. They remove the original native plants and develop their properties. With the winter rains, they realize they have to drain these vernally wet areas by ditching and culverts to reduce the impact on their converted land uses. Drainage ditches remove surface water quickly and don’t allow the wetlands and soils to retain the water for summer use (Hinman, 2001). The increased volume and velocity of stormwater entering the creeks causes increased erosion and sedimentation which often begets further indignities such as streambank armouring, which in turn increases velocity and reduces habitat quality (Government of Ontario, 2004). Although erosion and deposition of soil material from the watershed is a natural process, excessive erosion can lead to many serious consequences. The two largest causes of ongoing erosion within Gooch Creek seem to be caused by livestock and road maintenance. Several hobby farms have livestock that have access to the riparian areas and to the creeks. Livestock, especially horses, walk through the creeks and seasonal wetlands and destroy the ground cover, remove vegetation, break down the creek channels and cause transport of soil materials. The road maintenance staff clear the roadside ditches with mechanical equipment that scour the bottom of the ditches, removing all vegetation. Bare earth is left to be transported by the winter rains into ditches leading to the creek, contributing to siltation. This work is carried on without regard to proper timing or best management practices (pers. obs, 2003-2004). Trout have good auditory and visual abilities that they use for survival. Suspended solids from erosion reduce their ability to see their prey and their predators, thereby reducing their food intake, increasing risk from their enemies and contributing to higher mortality. It can abrade and clog the gills and breathing apparatus of fish and invertebrates. Suspended solids also reduce the amount of light for photosynthesis; thus reducing algae growth which in turn reduces food for invertebrate species (NSDF and DFO, 1994), which are a food source for birds, mammals such as river otters, fish, snakes and amphibians. Juvenile red-legged frogs feed upon algae (Corkran and Thoms, 1996). Siltation and sedimentation can fill the spaces between the gravel, reducing habitat for invertebrates and juvenile fish. It can also coat the redds or spawning beds and prevent oxygen from reaching the developing cutthroat trout embryos and alevins, again contributing to higher mortality rates (NSDF and DFO, 1994). Contamination of surface, and possibly, groundwater, is evident from the water analysis (appendices 25 and 26). Fecal coliform counts are extremely high. This could be the result of failing septic systems and/or livestock manure. Several properties have livestock in the waterways as well as storing manure next to the waterways. Winter rains leach through these manure piles to pollute the water. CRD Health has stated that 25% of all septic systems are failing (Bergner, pers. comm., 2003) and this would indicate a high probability that some septic systems could be adding to the fecal coliform counts. If the CRD enacts the proposed legislation to order septic system inspection by 2005 and regular pumpouts every 3 to 5 years, the question of septic system contamination might be alleviated. The was no testing for pesticides or non point source pollution such as oil or gas, which is an expensive process. Chemical analysis of soil and water indicate higher than usual background rates of some heavy metals (appendice 4). The Metchosin town centre has several operating and abandoned businesses that could be a source of pollution. One abandoned site has seen business as an auto wrecking yard, highways maintenance yard and auto storage yard. Some of these businesses were running when groundwater contamination was not considered a factor in regulation. There is an auto repair business which might be of concern, as apparently there are no special contaminant disposal systems in place. It is probable that there are serious contaminants in the soil and possible movement of these through the soil and groundwater. The vacated gas station recently had its tanks and pumps tested and they were been found to be in good condition. This business had oil and water separators on each side of its property which were pumped out regularly (Cooper, 2003, pers. comm.). The restaurant is a relatively new business that would have had to comply with all the newest building codes. However, many trees to the rear of the property are dying, perhaps from installation of the sewage system, which would change the hydrology of the area and could seriously affect the health of the trees. There is a corner store which does not allow patrons to use their washroom facilities, a community hall which is open only occasionally, a recently decommissioned elementary school, a church that is used only for special events and a part-time nursery school. It is not known if farmers use much pesticide in an ongoing manner. The use of road salt during the very occasional snow and ice conditions could be of concern. The invertebrate surveys, conducted during Streamkeeper assessments indicate an extremely poor aquatic habitat for invertebrates. Considering the surveys were conducted in an area of a reach that was deemed to be of high quality by all other methods of assessment, the question is raised as to why the invertebrate assessment is so dismal. It could be that this is the proverbial “canary in the coal mine” and there are unknown toxins affecting the creek health. More in depth chemical analysis should help to pinpoint the nature, if any, of the toxic substances affecting the invertebrate populations (and by extension, the creek biota). Equally the invertebrates could be suffering from sediment deposition that seems to occur with higher frequency during springtime .
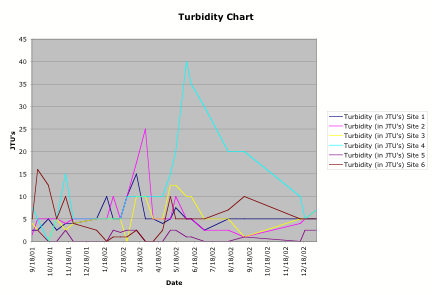
Figure 9 Turbidity Chart of Sites 1-6
Impermeable surfaces are not a large concern in a rural setting. Most driveways are gravel and a large proportion of the land is permeable, although not always clothed with native vegetation and probably not as effective in retaining the water table as the original forested land. Invasive species are a large problem throughout southern Vancouver Island and Metchosin is no exception. Daphne (Daphne laureola), Himilayan blackberry (Rubus discolor), English ivy (Hedera helix), broom (Cytisus scoparius), gorse (Ulex europeus), holly (Ilex sp.) and various introduced grasses are all thriving and expanding their range throughout the watershed (pers. exp.), especially in disturbed areas. Daphne, holly and ivy all cause serious concern in shaded areas, where they succeed in displacing native species. One section of upland vegetation at 4609 William Head Rd. consists of 40% daphne ( see appendice 1). Since fall of 2002, the properties from 4609-4645 William Head Rd have had a commercial supplier to the floral trade harvesting their vast daphne understory. Although the plants are only selectively pruned for their foliage, it is hoped that the harvesting will at least slow their relentless progress. However, if daphne responds like most other aggressive colonizers, it could actually stimulate growth and flowering. Water quality: Water temperatures of 9-12ºc are the optimum, spawning is 6-17ºc, incubation is 10-11 ºc, juveniles prefer 15 ºc. Outmigration occurs at 4-6ºc and immigration at 9-12ºc (Pauley et al, 1989). Maximum for long term exposure for eggs is 12ºc (Sigma Resource Consultants Ltd., 1979). Turbidity: for incubation-3mg/L and for rearing-25 mg/L (Sigma Resource Consultants Ltd., 1979). Above 35 mg/L is problematic (Pauley et al, 1989). Government of Canada guidelines for salmonid habitat recommend turbidity should not exceed 8 NTU’s (BCAWQGC), 1998). Dissolved oxygen at 85% saturation levels at 20ºc for general rearing and 98% at 0-15ºc for incubation of mature eggs and larvae (Sigma Resource Consultants Ltd., 1979). pH of 6-8.5 (Taccogna and Munro [eds], 1995) TDS: The US considers readings above 230 JTS’s to be problematic to aquatic health (Duluth Streams.org, March 29, 2004) although there are no guidelines set by the Canadian government. Water quality results/discussion:
i. Lack of shade and slow moving water contribute to high water temperatures at site one. This is a natural condition of a marsh with a barrier berm. However, in site two, water flow is restricted by the presence of the dyke/driveway which causes sediment to be dropped in the pond and consequently the pond has become quite shallow over the years, contributing to high water temperatures High summer water temperatures in site 5 are probably the result of water column stratification and inadequate shade
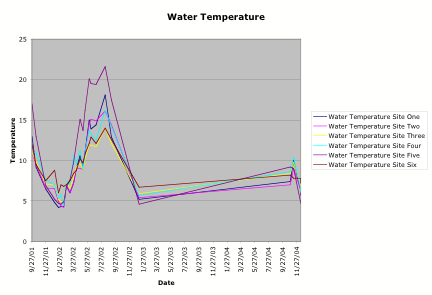 Figure 10 Water Temperature From Sites 1-6
ii. Low flows and low to non-existent turbulence at both site one and two during the summer, coupled with high water temperatures produce extremely low dissolved oxygen levels, problematic for salmonid survival. Site six is spring fed and springwater is often normally unoxygenated (T. Rutherford, 2002, pers. comm.)
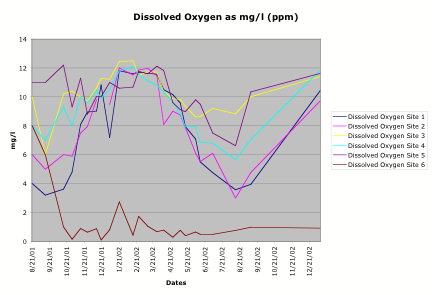 Figure 11 Dissolved Oxygen Chart From Sites 1-6
iii. Turbidity probably reflects stormwater issues and is of great concern because the increased siltation caused by turbidity, especially happening during the spring when the trout have just finished spawning, can negatively, even catastrophically, affect the developing trout embryos and alevins. iv. pH levels are probably a reflection of the high mineral content of the soils the stream drains. Although higher than salmonids and amphibians generally tolerate, local species are probably adapted to these conditions. Site five had an extremely high spike in pH, during one summer, probably the result of an algal bloom. Eutrification coupled with sunlight reaching the sediment layer and a stratified water column, with high water temperatures on the top layer, are the probable cause of algal blooms (DIP&NR, 2004). Algal blooms can cause fluctuations in dissolved oxygen concentrations and pH as well as turbidity. When the algae die they releases large amounts of waste product and bioavailable nitrogen and consume large quantities of dissolved oxygen. They can be toxic and produce offensive odours (Rose, 2004). They produce a very difficult environment for aquatic species to survive.
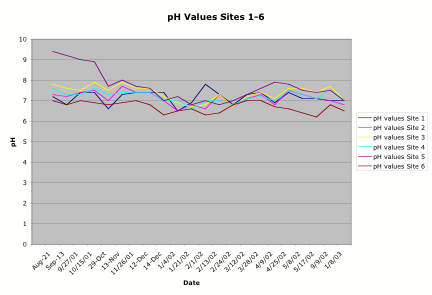 Figure 12. pH Chart From Sites 1-6
v. Coastal BC streams are generally considered to experience TDS readings of 75 JTU’s (Resources Inventory Committee, 1998). The readings in Gooch Creek are somewhat higher than coastal norms and could be the result of local variation from mineral laden soils or from agricultural or failed septic system inputs. The spike in readings at site one indicate saltwater incursion into the marsh.
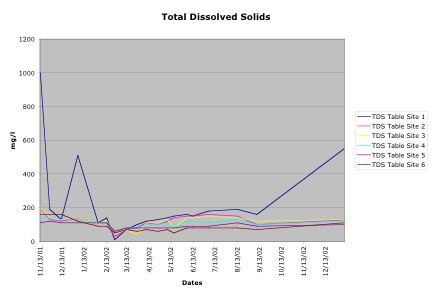 Figure 13 Total Dissolved Solids From Sites 1-6
vi. Chemical water analysis conducted throughout the study show extremely high fecal coliform counts. These could be from livestock and manure piles in proximity to the creek or from failing septic systems. The higher summer readings evidenced in appendice 26 might indicate septic system failure rather than livestock or manure piles, as there is very little stormwater available in the summer to transport pollutants. Reaches: a) Beach Taylor Beach and the outlet of Gooch Creek are littered with thousands of logs of varying sizes and extreme storms and tides redistribute them over the course of the winter. These logs would not have been in such profusion pre-European contact and the advent of large scale commercial logging. It is unknown what effect these logs have on helping or hindering access of the creek and fish from Gooch Creek to Parry Bay or on the condition of the barrier berm. b) Marsh The brackish marsh surrounding much of reach one is a dynamic, productive ecosystem that doesn’t exhibit a great deal of plant biodiversity. Many birds and animals utilize the marsh for food, shelter and/or breeding at various times of the year. It is periodically submerged under freshwater and occasionally flooded with saltwater. The plant communities that survive must be able to adapt to extreme growing conditions. Several years ago saw the last of the glasswort (Salicornia virginica) population disappear (Fletcher, 2001 pers. comm.), which would appear to indicate a change to a more freshwater ecosystem than would support the saltwater loving glasswort (Pojar and MacKinnon, 1994). However, a soil sample taken in 2003 to a two metre depth indicates a sedge meadow community has existed for millennia. R. Hebda (per.comm., 2003) considers sedge meadow soils to accumulate at the rate of one metre per one thousand years. Unfortunately the bridge and boardwalk that was used to set locations of other soil sampling (appendices 2 and 3) were washed away in the winter of 2001-2002. Sedges (Carex and Scripus spp.), grasses, sea arrow grass (Triglochin maritimum), cattails, (Typha latifolia) and silverweed (Potentilla aserina ssp. pacifica) are abundant species within the marsh. At some time in the past the marsh was ditched, probably to facilitate grazing. The marsh has been used as a sheep pasture but this use was discontinued when the sheep were fatally poisoned while grazing (G. Fletcher, 2001, pers comm.). The toxic Pacific water parsley (Oenanthe sarmentosa) is common throughout the marsh. Some of these ditches hold water well into the summer and function as off channel habitat for sticklebacks. Logs located at the eastern edge of the marsh approximately 150 m from the mouth of the creek, indicate (an) extremely high tide and/or storm event(s) in the past. The invasive reed canary grass (Phalaris arundinacea) and *common reed (Phragmites australis) are present. As evidenced by the marsh plant communities map (figure 7), as the marsh progresses further from the zone of saltwater incursion the plant species change from salt tolerant to salt intolerant, from Carex lyngbyei to Carex obnupta. A new and handsome bridge (figure 14) has been built to cross Gooch Creek in the marsh. Very recently one of the property owners has constructed a clay causeway (figure 15) to midway across the marsh, aimed towards the bridge. This seems likely to reduce free and natural movement of water through the marsh and this situation should be monitored for consequences.
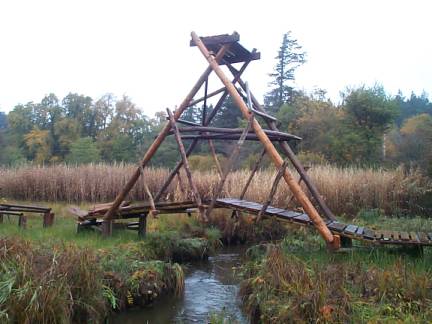 Figure 12 New Bridge
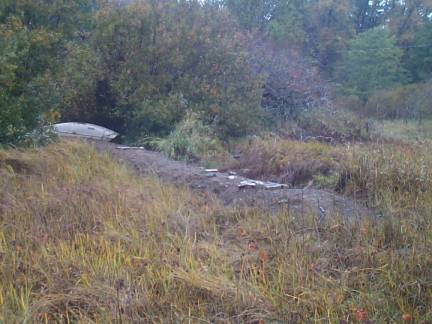 Figure 13 Clay Causeway c) Reach One From the Parry Bay outlet to an alder (Alnus rubra) / skunk cabbage (Lysichiton americanum) swamp.
Ed Note: There are more willows here than alders.
The creek continues through the alder swamp until it reaches the driveway and culvert/weir. USHP data interpretation suggests that the creek needs more large woody debris (LWD) in this reach (table 11). However, it is possible that there would naturally be very low LWD retention here as the creek runs through the marsh and there are no trees for recruitment. Since the reach was considered to include both the marsh and swamp (as per instructions from L. Carswell), the data regarding crown cover doesn’t accurately represent the reach. There is no crown cover in the marsh section, as marshes, by definition, don’t sustain trees. Swamps however, do include trees (Scott, 1995). The tree cover in the swamp is more accurately represented by the numbers shown in reach three, which indicates 85% crown cover. Historically there would have been no pond and driveway between what is now known as reach one and three, suggesting they would have had similar characteristics. Sixty percent crown cover is considered the ideal balance for cover values, algae and riparian growth (NSDF and DFO, 1994). It is probable that the driveway has reduced sediment recruitment to reach one, since this is dropped in the constructed pond on the upstream side of the driveway. The pond has been in existence for 30 plus years. There are several dwellings adjacent to the marsh and creek and it is unknown if their septic systems adversely affect the water quality. Low dissolved oxygen (DO2) and high temperatures during the summer are limiting factors. These criteria are not met during the summer in the marsh, but may be met in the swamp portion of the reach, which is well shaded. Sticklebacks can be found in this reach year round. Reach one is infrequently inundated with salt water, usually during extreme high tides and winter storm events, as evidenced by the TDS readings and the analysis of the marsh soil sample. Table 5 Site One Water Sampling (Conducted at Bridge in Marsh)
|
Date |
Time |
DO |
pH |
TDS |
Temp/air |
Temp/water |
Turbidity |
Depth |
|
Jul-31 |
11:00 AM |
6.5 |
7 |
60 |
24 |
16.6 |
||
|
Aug-15 |
4 |
8.5 |
16 |
24 |
||||
|
Aug-21 |
12:00 PM |
4 |
7.2 |
15 |
20 |
|||
|
Sep-13 |
10:30 AM |
3.2 |
6.8 |
20 |
14 |
71 |
||
|
18-Sep |
9:15 AM |
7.3 |
15 |
14 |
2.5 |
69.5 |
||
|
9/27/01 |
9:00 AM |
2 |
7.4 |
14 |
13 |
2.5 |
76 |
|
|
Oct-01 |
10:00 AM |
3.11 |
7.4 |
14 |
13 |
2.5 |
76 |
|
|
10/15/01 |
11:00 AM |
3.62 |
7.4 |
9.2 |
5 |
60 |
||
|
29-Oct |
10:00 AM |
4.8 |
6.6 |
250 |
11 |
7.4 |
2.5 |
65 |
|
13-Nov |
10:00 AM |
8.1 |
7.3 |
1000 |
8 |
10 |
4 |
85 |
|
14-Nov |
3:00 PM |
370 |
78 |
|||||
|
15-Nov |
1:00 PM |
150 |
||||||
|
19-Nov |
10:30 |
100 |
||||||
|
23-Nov |
2:45 PM |
50 |
||||||
|
11/26/01 |
11:00 AM |
8.95 |
7.4 |
190 |
5 |
6.5 |
4 |
48 |
|
12/3/01 |
155 |
|||||||
|
12/6/01 |
75 |
|||||||
|
12-Dec |
11:45 AM |
9.02 |
7.4 |
130 |
7 |
6.5 |
5 |
68 |
|
14-Dec |
9:15 AM |
10.6 |
7.4 |
100 |
10 |
5.7 |
13 |
60 |
|
17-Dec |
||||||||
|
20-Dec |
2:00 PM |
10.83 |
6.7 |
150 |
8 |
5.7 |
5 |
49 |
|
1/4/02 |
12:00 PM |
7.18 |
6.5 |
510 |
10 |
4.8 |
5 |
120 |
|
6-Jan |
3:00 PM |
12 |
135 |
|||||
|
7-Jan |
11:00 AM |
158 |
||||||
|
1/21/02 |
10:30 AM |
11.82 |
6.9 |
130 |
5 |
4.2 |
10 |
63 |
|
2/1/02 |
10:30 AM |
12.48 |
7.8 |
110 |
6 |
4.3 |
5 |
21 |
|
2/13/02 |
11:00 AM |
11.6 |
7.3 |
140 |
5 |
4.3 |
5 |
40 |
|
2/24/02 |
2:30 PM |
11.71 |
6.8 |
10 |
7 |
6.9 |
10 |
30 |
|
3/12/02 |
11:00 AM |
11.63 |
7.3 |
70 |
8 |
6 |
15 |
42 |
|
3/27/02 |
2:30 PM |
11.42 |
7.7 |
100 |
6 |
6.9 |
5 |
21 |
|
3/28/02 |
10:30 AM |
11.57 |
7.4 |
90 |
8 |
7.2 |
20 |
24 |
|
4/9/02 |
11:00 AM |
10.5 |
6.9 |
120 |
10 |
9 |
5 |
11.5 |
|
4/25/02 |
1:45 PM |
10.16 |
7.4 |
130 |
15 |
10.6 |
4 |
16 |
|
5/8/02 |
10:00 AM |
9.58 |
7.1 |
140 |
8 |
9.3 |
5 |
39 |
|
5/17/02 |
11:00 AM |
7.94 |
7.1 |
150 |
13.5 |
11.1 |
7.5 |
39 |
|
6/4/02 |
3:00 PM |
7.08 |
7.4 |
160 |
16 |
15 |
5 |
43.5 |
|
6/12/02 |
11:30 AM |
5.5 |
150 |
20+ |
13.9 |
5 |
51.5 |
|
|
7/4/02 |
11:00 AM |
4.76 |
180 |
14 |
14.4 |
2.5 |
55 |
|
|
8/13/02 |
2:00 PM |
3.57 |
190 |
25+ |
18.1 |
5 |
63 |
|
|
9/9/02 |
10:00 AM |
3.95 |
7 |
160 |
20 |
12.9 |
5 |
68 |
|
1/8/03 |
11:00 AM |
10.44 |
7 |
550 |
4 |
5.2 |
5 |
57 |
d) Reach Two Considered the “Ben Acre” constructed pond, measuring approximately 65 m x 30 m (1950 square m), sticklebacks and cutthroat trout have been found here. USHP data interpretation suggests there is not enough LWD, which would add cover for aquatic dwelling species. All other negative interpretations are natural conditions associated with a pond. Crown cover has been listed as poor (not sufficient cover), but that is misleading. Although the cover grows along the edge of the pond and the pond itself is only 10% covered, the pond is well shaded because the trees are large and throw their shade for a long distance. The entire pond is green with duckweed (Lemna minor) by August, the excessive plant life, indicative of eutrification, would contribute to higher DO2 levels during the day and lower levels at night when the plants are excreting carbon dioxide. The duckweed adds cover-protecting the inhabitants from predation, reduces algae and consumes nutrients. It could also contribute to lower dissolved oxygen levels when it decomposes in the fall and winter (Cross, 2003). The pond has been infilling for decades and is much shallower than when it was originally constructed (Chettleberg, pers.comm., 2001). Low summer flows adversely affect the conditions because water flow is insufficient to maintain high water levels in the pond, causing the water level to drop, again reducing the summer habitat and water quality. The driveway and associated culverts and weirs block the natural flow of water and gravel recruitment. Additionally, the weir, which restricts water flow through the culvert and driveway, leaks, with the water running under the driveway, preventing access to the habitat of reach one during the low summer flows and draining the pond. The original design of the weir also prevents easy access for the fish. The driveway is occasionally flooded in winter. Table 6 Site Two Water Sampling (Conducted in Ben Acre Pond)
|
Date |
Time |
DO |
pH |
TDS |
Temp/air |
Temp/water |
Turbidity |
|
Jul-31 |
1:00 PM |
8.3 |
7.3 |
130 |
24 |
15.7 |
|
|
Aug-15 |
8 |
7 |
24 |
16 |
|||
|
Aug-21 |
2:00 PM |
6 |
7.3 |
20 |
14 |
||
|
Sep-13 |
11:00 AM |
5 |
7.2 |
20 |
12 |
||
|
18-Sep |
9:45 |
7.3 |
15 |
14 |
1.5 |
||
|
27-Sep |
9:30 AM |
7 |
7.4 |
14 |
11 |
5 |
|
|
15-Oct |
10:30 AM |
6 |
7.5 |
9.5 |
5 |
||
|
29-Oct |
10:30 AM |
5.9 |
7 |
200 |
11 |
7 |
5 |
|
13-Nov |
10:15 AM |
7.5 |
7.7 |
200 |
8 |
9 |
4 |
|
26-Nov |
11:10 AM |
7.95 |
7.4 |
130 |
5 |
6.6 |
5 |
|
12-Dec |
12:00 PM |
9.81 |
7.4 |
120 |
7 |
6.5 |
4 |
|
17-Dec |
2:15 PM |
10.41 |
7 |
110 |
8 |
5.8 |
5 |
|
1/4/02 |
12:15 PM |
9.48 |
6.5 |
140 |
10 |
6.5 |
5 |
|
1/21/02 |
10:40 AM |
12 |
6.8 |
90 |
5 |
4.9 |
5 |
|
2/1/02 |
10:40 AM |
12.65 |
6.6 |
110 |
6 |
4.4 |
10 |
|
2/13/02 |
11:10 AM |
11.52 |
7.3 |
110 |
5 |
4.2 |
5 |
|
2/24/02 |
2:45 PM |
11.86 |
6.7 |
30 |
7 |
6.9 |
10 |
|
3/12/02 |
11:15 AM |
11.98 |
7.1 |
70 |
10 |
6 |
17.5 |
|
3/28/02 |
10:45 PM |
11.45 |
7.3 |
80 |
8 |
7.2 |
25 |
|
4/9/02 |
11:30 AM |
8.09 |
6.8 |
110 |
10 |
9 |
5 |
|
4/25/02 |
2:00 PM |
9.1 |
7.5 |
100 |
15 |
9 |
5 |
|
5/8/02 |
10:15 AM |
8.75 |
7.3 |
120 |
8 |
8.9 |
5 |
|
5/17/02 |
11:15 AM |
7.88 |
7.1 |
140 |
13.5 |
10.9 |
10 |
|
6/4/02 |
3:15 PM |
6.1 |
7.2 |
150 |
16 |
14.5 |
5 |
|
6/12/02 |
11:45 AM |
5.53 |
150 |
20+ |
15.1 |
5 |
|
|
7/4/02 |
11:15 AM |
6.1 |
160 |
14 |
14.9 |
2.5 |
|
|
8/13/02 |
2:15 PM |
3 |
150 |
25+ |
16.1 |
2.5 |
|
|
9/9/02 |
10:15 AM |
4.77 |
7 |
100 |
20 |
14.4 |
1 |
|
1/8/03 |
11:15 AM |
9.73 |
6.8 |
128 |
4 |
5.4 |
7 |
e) Reach Three A fairly flat, slow moving section of the creek with a gradient of 1-2%. USHP data interpretation suggests that there is not sufficient LWD. Crown cover is 85%, too shady for ideal growth conditions (NSDF and DFO, 1994). Much of this reach flows through an alder swamp and this is reflected in the low % cover of pools, most of the riparian vegetation is skunk cabbage. Reach three was not part of the water quality analysis, but it is assumed it would be similar to reach four. The cutthroat trout have been found spawning only in reach three, four and five. f) Reach Four A short (19.5m), relatively steep section of the creek. USHP data interpretation indicates a shortage of LWD. Water quality is excellent for most parameters but fecal coliform counts are extremely high (appendices 25 and 26). Table 7 Site Three Water Sampling at Large Boulders in Reach Four
|
Date |
Time |
DO |
pH |
TDS |
Temp/air |
Temp/water |
Turbidity |
|
Jul-31 |
4:30 PM |
8.3 |
7.4 |
123 |
20 |
||
|
Aug-14 |
10:30 AM |
7 |
7.2 |
||||
|
Aug-15 |
7 |
7.2 |
24 |
16 |
|||
|
Aug-21 |
3:00 PM |
10 |
7.8 |
21 |
13 |
||
|
Sep-13 |
1:00 PM |
6 |
7.6 |
20 |
12 |
||
|
18-Sep |
10:15 AM |
7.9 |
15 |
13 |
4 |
||
|
27-Sep |
10:00 AM |
9 |
7.5 |
14 |
11 |
2.5 |
|
|
15-Oct |
11:00 AM |
10.2 |
7.9 |
9.9 |
0 |
||
|
29-Oct |
11:00 AM |
10.4 |
7.5 |
210 |
11 |
8.4 |
5 |
|
13-Nov |
10:30 AM |
10 |
7.9 |
200 |
8 |
9.8 |
2.5 |
|
26-Nov |
11:20 AM |
9.7 |
7.6 |
140 |
5 |
7.1 |
4 |
|
12-Dec |
12:15 PM |
10.62 |
7.6 |
130 |
7 |
7 |
5 |
|
20-Dec |
2:30 PM |
11.28 |
7.2 |
120 |
8 |
6.2 |
5 |
|
1/4/02 |
12:30 PM |
11.22 |
6.9 |
140 |
10 |
7 |
5 |
|
1/21/02 |
11:00 AM |
12.43 |
6.7 |
5 |
5.2 |
5 |
|
|
2/1/02 |
11:00 AM |
12.66 |
6.8 |
110 |
6 |
4.9 |
5 |
|
2/13/02 |
11:30 AM |
12.5 |
7.3 |
120 |
5 |
5 |
5 |
|
2/24/02 |
3:00 PM |
11.47 |
6.7 |
40 |
5 |
7.3 |
10 |
|
3/12/02 |
11:30 AM |
11.74 |
7.2 |
70 |
7 |
6.6 |
10 |
|
3/28/02 |
11:00 AM |
11.72 |
7.4 |
40 |
8 |
7.9 |
10 |
|
4/9/02 |
12:00 PM |
10.36 |
7.1 |
110 |
10 |
9.2 |
5 |
|
4/25/02 |
2:45 PM |
9.87 |
7.6 |
110 |
15 |
9.6 |
5 |
|
5/8/02 |
10:45 AM |
9.83 |
7.6 |
130 |
9 |
8.9 |
12.5 |
|
5/17/02 |
11:45 AM |
9.35 |
7.4 |
80 |
13.5 |
10.2 |
12.5 |
|
6/4/02 |
3:30 PM |
8.62 |
7.1 |
140 |
16 |
11.9 |
10 |
|
6/12/02 |
12:00 PM |
8.63 |
140 |
20+ |
11.9 |
10 |
|
|
7/4/02 |
11:30 AM |
9.2 |
150 |
14 |
11.7 |
5 |
|
|
8/13/02 |
2:30 PM |
8.83 |
140 |
25+ |
14 |
5 |
|
|
9/9/02 |
10:30 AM |
10.01 |
7.7 |
120 |
20 |
12.1 |
1 |
|
1/8/03 |
11:30 AM |
11.41 |
7 |
130 |
4 |
5.9 |
7 |
g) Reach Five By approximately 200m, and the only significant limiting factor is a shortage of LWD. h) Reach Six Approximately 200m of relatively flat gradient, surrounded by hobby farms. USHP data interpretation indicate this reach is impacted by low LWD recruitment, obstruction by fences, siltation, land use issues, 85% crown cover in some sections and turbidity. At one point previous landowners allowed horses to wander in the creek, but the present landowners fence them out. One area previously impacted by horses is slowly producing riparian vegetation, although not all of it is appropriate. The introduced Himalayan blackberries are becoming rampant. The creek has become a shallow, grassed ditch in one section. The landowners also have a burn site in a wet area of the yard, beside the creek, which drains directly into the creek, possibly adversely affecting water quality. Water quality analysis (table 8) suggest a concern with turbidity. A channelized tributary or ditch joins reach six at 4565 William Head Rd and seasonally carries water from a vernal creek. The amount and velocity of stormwater is causing erosion of this property along the ditched section and in particular it is undermining a bridge used by the owners and horses to access a pasture. The owners would like to see this situation improve for them, without losing property or becoming a financial burden to them. They are considering culverting the ditch to reduce erosion and property loss. There is a large manure pile which sits on a concrete pad adjacent to the seasonal tributary, which likely contributes to the fecal coliform counts. Table 8 Site Four Water Sampling Conducted at Plaxton Property
| Date | Time | DO | pH | TDS | Temp/air | Temp/water | Turbidity |
|
Aug-21 |
12:00 PM |
8 |
7.6 |
21 |
14 |
||
|
Sep-13 |
1:00 PM |
7 |
7.3 |
20 |
14 |
7.5 |
|
|
1-Oct |
12:30 PM |
9 |
7.3 |
20 |
11 |
5 |
|
|
15-Oct |
11:30 AM |
9.3 |
7.6 |
11 |
0 |
||
|
30-Oct |
9:00 AM |
8 |
7.3 |
200 |
11 |
8.6 |
5 |
|
14-Nov |
3:15 PM |
10 |
7.4 |
140 |
10 |
10.4 |
15 |
|
26-Nov |
1:00 PM |
9.6 |
7.4 |
140 |
5 |
7.6 |
5 |
|
12-Dec |
12:30 PM |
10.47 |
7.4 |
130 |
7 |
6.7 |
10 |
|
20-Dec |
2:45 PM |
9.92 |
7 |
120 |
8 |
6 |
5 |
|
1/4/02 |
12:45 |
10.52 |
7 |
130 |
10 |
7 |
5 |
|
1/21/02 |
11:30 AM |
11.8 |
6.6 |
5 |
5.3 |
5 |
|
|
2/6/02 |
10:30 AM |
11.25 |
7 |
110 |
6 |
5.8 |
5 |
|
2/14/02 |
1:30 PM |
12.1 |
7 |
110 |
6 |
4.4 |
5 |
|
2/24/02 |
3:45 PM |
11.53 |
6.8 |
50 |
6 |
7.4 |
10 |
|
3/12/02 |
12:00 PM |
11.11 |
7.1 |
80 |
10 |
7.1 |
10 |
|
3/28/02 |
1:00 PM |
10.81 |
7.2 |
80 |
8 |
10.6 |
10 |
|
4/9/02 |
2:45 PM |
10.36 |
7 |
100 |
10 |
9.6 |
10 |
|
4/25/02 |
2:30 PM |
9.65 |
7.5 |
100 |
15 |
11.2 |
10 |
|
5/8/02 |
11:00 AM |
8.82 |
7.3 |
110 |
8 |
9 |
15 |
|
5/17/02 |
11:45 AM |
7.93 |
7.1 |
80 |
13.5 |
11.2 |
20 |
|
6/4/02 |
3:45 PM |
7.97 |
6.8 |
120 |
16 |
13.7 |
40 |
|
12-Jun |
12:15 PM |
6.85 |
120 |
20+ |
13.3 |
35 |
|
|
7/4/02 |
11:45 AM |
6.8 |
110 |
14 |
12.5 |
30 |
|
|
8/13/02 |
2:45 PM |
5.67 |
130 |
25+ |
16.2 |
20 |
|
|
9/9/02 |
11:45 AM |
7.05 |
7.5 |
100 |
20 |
14.2 |
20 |
|
1/9/02 |
11:30 AM |
11.85 |
7 |
120 |
4 |
5.7 |
7 |
i) Reach Seven and Eight Both considered separate from reach 6 because of the culverts which begin and end them. USHP data interpretation suggests they both lack LWD and the culverts serve as obstructions. Reach 7 has some bank armouring constructed from wooden planks, downstream from a culvert. Reach 8 periodically causes flooding concerns to the landowners. The crown cover values range from 85-90%, too shady for ideal algal growth conditions (NSDF and DFO, 1994). No water quality testing was done through this section as it was considered too much of a burden to the landowners, who are nervous of government interference. j) Reach Nine A constructed pond, approximately 84.5 m X 40 m (3380 square m) pond. The pond feeds the creek system through groundwater and through an overflow mechanism. Turtles, muskrats, red-winged blackbirds, marsh wrens and ducks are resident here and river otters visit occasionally. The pond is periodically stocked with rainbow trout but they do not endure. USHP data interpretation suggests the “Parker” pond suffers from fluctuating pH, high summer water temperatures, which can be significantly higher than the surrounding air temperature. The pond will periodically form a large dome-shaped mass, which rises to the surface of the water (Parker, 2002, personal communication) before disintegrating, probably an algal bloom. Purple loosestrife (Lythrum salicaria) has been found in several locations around the pond. Table 9 Site Five Water Sampling Conducted at Parker’s Pond
|
Date |
Time |
DO |
pH |
TDS |
Temp/air |
Temp/water |
Turbidity |
|
12-Aug |
9:00 AM |
11 |
8.5 |
77 |
20.8 |
21.1 |
|
|
15-Aug |
11 |
8.5 |
|||||
|
18-Aug |
9.5 |
24 |
|||||
|
Aug-21 |
12:00 PM |
9.4 |
20 |
||||
|
Aug-28 |
9.4 |
21 |
|||||
|
Sep-13 |
1:30 |
11 |
9.2 |
20 |
20 |
2.5 |
|
|
1-Oct |
1:00 PM |
11 |
9 |
20 |
17 |
2.5 |
|
|
15-Oct |
12:00 PM |
12.2 |
8.9 |
13 |
0 |
||
|
29-Oct |
12:00 PM |
9.3 |
7.7 |
130 |
11 |
9.2 |
0 |
|
14-Nov |
3:30 PM |
11.3 |
8 |
110 |
10 |
9 |
2.5 |
|
26-Nov |
13:15 |
8.8 |
7.7 |
120 |
5 |
6.9 |
0 |
|
12-Dec |
12:45 PM |
10.03 |
7.6 |
110 |
7 |
5 |
0 |
|
20-Dec |
3:00 PM |
10.01 |
7 |
110 |
8 |
4.7 |
2.5 |
|
1/4/02 |
1:00 PM |
11 |
7.2 |
110 |
10 |
5.2 |
0 |
|
1/21/02 |
11:45 AM |
10.6 |
6.8 |
110 |
5 |
4.7 |
0 |
|
2/6/02 |
10:45 AM |
10.58 |
7 |
110 |
6 |
4.6 |
2.5 |
|
2/14/02 |
1:30 PM |
10.68 |
6.8 |
110 |
6 |
4.9 |
2 |
|
2/24/02 |
4:00 PM |
11.77 |
7 |
60 |
6 |
6.7 |
2.5 |
|
3/12/02 |
12:30 PM |
11.6 |
7.3 |
80 |
10 |
7.6 |
2.5 |
|
3/27/02 |
12:00 PM |
12.12 |
7.6 |
80 |
8 |
9.8 |
0 |
|
4/9/02 |
3:00 PM |
11.83 |
7.9 |
80 |
10 |
12.1 |
0 |
|
4/25/02 |
3:00 PM |
9.6 |
7.8 |
80 |
15 |
15.1 |
0 |
|
5/8/02 |
11:30 AM |
9.12 |
7.5 |
80 |
9 |
13.7 |
2.5 |
|
5/17/02 |
12:20 PM |
8.98 |
7.4 |
80 |
13 |
16.2 |
2.5 |
|
6/4/02 |
5:00 PM |
9.8 |
90 |
16 |
20.1 |
1 |
|
|
6/12/02 |
12:30 PM |
9.5 |
90 |
20+ |
19.5 |
1 |
|
|
7/4/02 |
12:00 PM |
7.5 |
90 |
14 |
19.4 |
0 |
|
|
8/13/02 |
3:00 PM |
6.62 |
110 |
25+ |
21.6 |
0 |
|
|
9/9/02 |
12:00 PM |
10.35 |
7.5 |
90 |
20 |
17.5 |
1 |
|
1/9/03 |
12:00 PM |
11.63 |
7 |
100 |
4 |
4.6 |
2.5 |
k) Reach Ten The remnants of Jones Brook, a sad ditched affair that, for much of its length, is accessed by livestock (horses, goats, pot-bellied pig). A trickle of water can be seen almost year round. USHP data interpretation indicates it lacks LWD, crown cover and riparian cover. It sustains injury from livestock access which leads to erosion and destruction of the creek bed. Previous landowners fertilized the field through which it runs, pesticide use is unknown. At one point a manure/straw pile sits just above the creek. The present landowners are in the process of selling the property. This reach is considered by PDF assessment to be nonfunctional and to have the worst assessment on USHP data interpretation l) Reach Eleven Jones Spring, which appears to have been bermed at some point. It is surrounded by a thick growth of Himalayan blackberry and a few conifers. There is no livestock access to this site. Table 10 shows extremely low dissolved oxygen levels. Higher DO2 levels were found within one metre of the surface, near the creek outlet. Water temperature remains acceptable throughout the year. Table 10 Site Six Water Sampling Conducted at Jone’s Spring
|
Date |
Time |
DO |
pH |
TDS |
Temp/air |
Temp/water |
Turbidity |
|
Aug-04 |
11:00 AM |
8 |
7 |
20 |
14 |
||
|
Aug-04 |
12:00 PM |
7.3 |
23 |
17 |
|||
|
Sep-04 |
2:00 PM |
6 |
6.8 |
20 |
14.5 |
5 |
|
|
1-Oct |
1:30 PM |
2 |
7 |
20 |
12 |
16 |
|
|
15-Oct |
12:30 |
one |
6.9 |
9.5 |
12.5 |
||
|
30-Oct |
9:15 AM |
0.15 |
6.8 |
260 |
11 |
8.2 |
5 |
|
14-Nov |
3:45 PM |
0.89 |
6.9 |
160 |
10 |
7.8 |
10 |
|
26-Nov |
1:30 |
0.64 |
7 |
160 |
5 |
7.5 |
4 |
|
12-Dec |
1:00 PM |
0.88 |
6.8 |
160 |
7 |
7.8 |
5 |
|
20-Dec |
3:15 PM |
0.1 |
6.3 |
130 |
8 |
7.2 |
5 |
|
1/4/02 |
1:15 PM |
0.81 |
6.5 |
120 |
10 |
8.8 |
2.5 |
|
1/21/02 |
12:00 PM |
2.74 |
6.6 |
90 |
5 |
6 |
0 |
|
2/6/02 |
0.92 |
6.3 |
90 |
6 |
7 |
1 |
|
|
2/14/02 |
0.43 |
6.4 |
90 |
6 |
6.8 |
1 |
|
|
2/24/02 |
16:30 |
1.73 |
6.8 |
50 |
6 |
7 |
1 |
|
3/13/02 |
2:00 PM |
1.05 |
7 |
70 |
6 |
7.5 |
2.5 |
|
3/27/02 |
2:00 PM |
0.67 |
7 |
60 |
8 |
8.4 |
0 |
|
4/9/02 |
3:15 PM |
0.78 |
6.7 |
70 |
10 |
8.8 |
0 |
|
4/25/02 |
3:15 PM |
0.29 |
6.6 |
60 |
15 |
10.2 |
2.5 |
|
5/8/02 |
11:00 AM |
0.77 |
6.4 |
70 |
8 |
9.7 |
10 |
|
5/17/02 |
12:30 PM |
0.4 |
6.2 |
50 |
13.5 |
10.8 |
5 |
|
6/4/02 |
5:15 PM |
0.65 |
80 |
16 |
12.1 |
5 |
|
|
6/12/02 |
12:45 PM |
0.49 |
80 |
20+ |
12.9 |
5 |
|
|
7/4/02 |
12:15 PM |
0.49 |
80 |
14 |
12.1 |
5 |
|
|
8/13/02 |
3:15 PM |
0.76 |
80 |
25+ |
14 |
7 |
|
|
9/9/02 |
12:15 PM |
0.98 |
6.8 |
70 |
20 |
12.6 |
10 |
|
1/9/03 |
12:15 PM |
0.92 |
6.5 |
110 |
4 |
6.7 |
5 |
m) Above Reach Eleven There is a vernal water system that has partially been tiled with drainage pipes to remove the water and allow access to the fields. Much of the vernal drainage area has been converted to rural use but the wetlands still occur in sections, with thick shrub growth consisting of willows (Salix sp.), ninebark (Physocarpus capitatus), salmonberry (Rubus spectibilis), bitter cherry (Prunus emarginata), Western red cedar (Thuja plicata), grand fir (Abies grandis) and Douglas fir (Psuedotsuga menziesii). Much of the originating wetlands have been developed to rural residential usage. 12. Recommendations * Recommendations for riparian planting widths, in the absence of provincial or municipal laws, are taken from Land Development Guidelines for the Protection of Aquatic Habitat, 1993, Fisheries and Oceans, Canada, for fish bearing streams (15 m from high water mark) and from Streamside Protection Policy Directives, 2001, Ministry of Water, Land and Air, British Columbia for non fish bearing streams and limited riparian vegetation (5 m). a) Water Quality To reduce turbidity and siltation, exclude livestock from riparian area and creek. Liaise with Road Coordinator to ensure best management practices are followed for ditch maintenance. To improve dissolved oxygen, reduce eutrification by removing manure sources near creek and work with landowners to inspect and correct septic systems. Restore natural hydrological regime as much as possible by replacing culverts with bridges. Plant appropriate riparian species where needed to provide cool water temperature. Deepen pools by adding LWD and ponds by dredging. Add aeration devise to Jone’s Spring to incorporate oxygen into spring water. Reduce pH fluctuations in Parker’s Pond by planting riparian trees to cool water temperatures and add aeration devise to destratify water column. b) Beach There are thousands of logs of varying sizes along Taylor Beach and extreme storms and tides redistribute them over the course of the winter. It would be a Herculean task to effectively reduce the quantity of logs to the historic numbers of a prelogging era. Since fish and river otters are still able to access the creek, this would seem to be an area of least concern. c) Marsh Filling in the ditches in the marsh would reestablish a more natural hydrological regime. However, the raised landforms around the marsh help the marsh to retain most of its groundwater. The soil sample taken using the Hillman post corer showed saturated, anaerobic conditions throughout the soil sample, indicating that the wetland is probably functioning as it should. Filling the ditches would reduce the off channel habitat that they have created but would help to keep water levels higher in the creek. Monitor for changes in marsh due to clay causeway. d) Reach One The water and septic systems should be tested to ascertain if there is any contamination from the septic systems adjacent to the marsh and creek. Continue water sampling, at least seasonally. Monitor potential spread of reed canary grass and *common reed. e) Reach Two, Ben Acre Pond To restore the natural hydrological regime a section of the causeway should be removed and replaced with a bridge. This would allow better access for fish, promote more natural gravel and sediment recruitment and reduce flooding potential. If the causeway and culverts are to remain, the main culvert/weir should be repaired to stop water leaking under the driveway. The pond should be dredged to provide deeper, cooler summer habitat. Add LWD to provide cover for aquatic inhabitants. Remove invasive species from the riparian zone. f) Reach Three To permit more sunlight to filter through, pull over some alders to decrease the canopy cover from 85 to 60%. Do not cut the roots, they will continue to provide stability to the banks and help prevent erosion. Add LWD to add complexity and increase habitat, this can be accomplished with wood from the downed trees. Remove invasive species from riparian zone. g) Reach Four Exhibits the best overall ecological integrity in all the reaches of the creek, to enhance this condition: Add LWD to add complexity and increase habitat. Remove invasive species from riparian zone Continue water testing from “site three” to monitor changes. h) Reach Five Creek considered in good condition, to enhance this condition: Remove invasive species from riparian zone. In the lower section, pull over some trees to decrease canopy cover to approximately 60%. Do not cut the roots. Add LWD to add complexity and habitat, use wood from the downed trees. Monitor effects of stormwater outlet from Parry X Rd. i) Reach Six Remove invasive species from riparian zone. Plant native willows to a width of 15 m along creek, around areas with horses to filter contaminants and erosion from horses and burn pile. The nonfunctional stormwater ditch through the Plaxton property needs to have some calming devises installed to reduce erosion and transport of sediment: Ø Construct the largest possible pond to hold and slow stormwater as it exits culvert from William Head Rd. Ø Construct Newbury weirs or log weirs to slow and calm stormwater. Ø If culverts are deemed necessary, use bottomless culverts instead of enclosed culverts Ø Plant native riparian species (willows, alders) along creek to stabilize banks. Ø Move manure pile as far from creek as possible or at least cover so that the runoff doesn’t leak into the creek. j) Reach Seven and Eight These sections could be considered a continuation of (USHP) reach 6. Some trees could be pulled over to decrease canopy cover and to add light to the optimum 60%. The two culverts contribute to flooding potential, remove and replace with bridges to partially restore natural hydrological regime and reduce risk of flooding. Maintain riparian vegetation. Conduct water testing during the first fall rains to gauge contaminant levels from town centre businesses. Conduct additional water quality tests if road salt has been used on William Head Rd during winter conditions involving snow and ice. Research products or procedures that would accomplish the purpose of using road salt without the presumed detrimental environmental effects. Work with road coordinator to apply best management practices to roadside ditching. k) Reach Nine, Parker Pond Plant native willows and trees to add filtering capabilities, provide greater bank stability, increased shade (which will decrease water temperature) and increased habitat and food source. Use a “destratifier” or air bubbler machinery to mix surface and bottom waters and reduce conditions favourable for algal blooms (DIP&NR, 2004). Remove invasive species, especially purple loosestrife before it spreads throughout the community. Discourage seeding with non-native fish because of the chance they could escape into Gooch Creek and compete for habitat with the native organisms. Monitor for aquatic life to gauge the effects of algal blooms. l) Reach Ten to Jones Spring (USHP) and reach 6 to end of first pasture (PDF) Plant native riparian species to a depth of 5 m to provide bank stability, reduce erosion and sediment transport, provide shade for cooler conditions and as habitat and food source. Add LWD. Remove invasive species such as Himalayan blackberry. Remove manure pile from below barns. Add LWD. m) Reach Eleven, Jone’s Spring Remove invasive species, Plant native riparian species to 5 m depth Add aeration device to supply oxygen Conduct chemical analysis of water to provide baseline water conditions. Ascertain reason for turbidity.
Summary of Restoration Priorities
Stormwater and livestock management is a high priority to reduce both erosion and siltation in the creek. Siltation causes a host of negative effects which seriously undermine the health of Gooch Creek and its inhabitants. Predator prey relationships, food sources, survival of young fish, amphibians and invertebrates and infilling of pools occur with improper runoff. One source of sediment laden runoff has been determined to be caused by livestock which are allowed access to the creek and riparian areas. Excluding them from these areas, by fencing, will help correct this situation. Partnering with the road contractor to devise less disruptive methods of keeping ditches clear is recommended. If ditches must be scrapped bare, they should be seeded with grass seed to reduce transport of sediment. Restoring the natural hydrological regime, as much a possible, is recommended. Where finances permit, remove culverts and replace with bridges. This will allow better access for fish to all parts of the creek, restore gravel recruitment, which is so important as habitat for invertebrates and to provide optimal spawning sites for cutthroat trout. Add LWD to the creek, this will help provide and maintain deeper, more functional pools that are used as summer habitat, which are needed to offset limiting conditions such as shallow water, low dissolved oxygen and high water temperatures. Studies have found an average of 80 m3 LWD per 100 m stream reach in unlogged tributaries in the Pacific Northwest with 2% gradient in < 8 km2 watersheds (Slaney and Zaldokas, 1997). Conduct an assessment of invasive species presence and abundance and design an invasive species management plan. Finding funds to implement a management plan can be difficult.
Table 11
USHP data interpretation indicates habitat parameter problems and solutions as follows (priorititized by degree of problem):
| Problem | Solution | What this Solution Does | Reach Involved |
| Shortage of LWD | Add LWD | Adds habitat, cover, promotes formation of more and deeper pools | All reaches |
| Shortage of boulders | Add boulders | Adds cover, promotes pool formation and enhancement | All except 4 (USHP) or 5 (PDF) |
| Low summer flows (% wetted area) | Plant native riparian species, dredge Ben Acre pond | Helps to maintain a higher water table, Adds summer habitat | 2, 6, 10 (USHP) 3, 5, 6,7 (PDF) |
| Siltation (% of fines) | Fence out livestock, Plant native riparian species Remove culverts and replace with bridges Liaise with road contractor | Reduces erosion potential | Fencing in reach 10 (USHP) 7 (PDF) Remove and replace culvert at Ben Acre pond and throughout Reach 7, 8 (USHP) 5 (PDF) |
| Shortage of riparian vegetation, cover (% cover in pools) | Plant native riparian vegetation Pull down trees Add boulders and LWD | Adds hiding places, supplies food and cools water More light can penetrate to permit better growth provides cover | Reach 10, Reach 3,5,6,7,8 (USHP) or 4, 5,6 (PDF) |
| Depth of riparian vegetation not adequate | Plant to a minimum depth of 5m or best possible | Provides filtering capabilities to remove pollutants, adds habitat | Reach 6, 10 (USHP) or 6 and 7 (PDF) |
The worst reaches are 10, 6 (USHP) or 5,6,7 (PDF) *The data indicates the marsh needs more riparian vegetation for cover and to reduce siltation. This data does not take into account that the marsh is a different type of ecosystem and therefore doesn’t support the general riparian species. *Siltation is caused by problems in the upper reaches of the creek system (low numbers for % of creek eroded in lower reaches) and is affecting all reaches. Removing the cause of erosion in upper reaches should control problems in lower reaches. *Low percent cover in pools has more than one cause. Reach 10 (USHP) 7 (PDF) has livestock grazing in the creek, removing all vegetation. Other reaches are quite shaded by the tree canopy and not enough light can pass through to provide optimal growing conditions for riparian species or for algae (food for invertebrates and juvenile frogs). *Low or no boulders and LWD for cover. Landowners might find the recommendation to pull over trees difficult to accept. Boulders are very difficult to move around, especially into creek valley. Incorporating them would probably cause more harm than good, by damaging fragile slopes and vegetation. Newly disturbed landscape would be ripe for further invasive species encroachment. *Reaches 6-8 (PDF) and 9-11 (PDF) above William Head Rd contribute significantly to the water flow of the Gooch Creek ecosystem. Improvement in these reaches would contribute to reducing the summer low flows by raising the water table and reducing the amount of erosion, would lessen siltation.
7. Monitoring
Monitoring is proposed to assess changes over time, to provide data that can determine adaptive management strategies and to gauge the success of restoration projects. Water quality testing should be continued at several sites, in order to compare with previous tests, to ascertain if there are upward or downward water quality trends. Testing for petro-chemicals should be completed to understand if there are toxicity problems (relating to past and present businesses) which could be affecting the fish and aquatic invertebrate populations in the creek. Gee trapping should occur at least twice a year, in spring and fall, under similar circumstances and at designated locations to assess fish presence. Biological indicator species should be used to assess ecosystem health. As stated earlier, aquatic invertebrate inventories were recorded in Gooch Creek. An improvement or deterioration in the biodiversity of aquatic invertebrate species and an increase or decrease in the number and abundance of certain sensitive aquatic invertebrates could indicate a swing in ecosystem health. Monitoring of aquatic invertebrates should be conducted at least yearly, at the same time and under similar conditions as previous inventories. Photopoint monitoring should be undertaken to show physical changes over time. Contrasting the 1930’s photo of Ben Acre marsh (fig 5) with the 2004 photo (fig 6) shows incursion of the invasive reed grass and human modifications to the marsh. Invasive species encroachment should be monitored and steps taken to prevent further incursion and reduce present populations. Monitor Parker’s Pond for aquatic life to gauge the effects of algal blooms.
8. Projects completed
In the winter of 2001 willows were harvested from the Chettleberg property that were used for live stake plantings on the Plaxton property. From about 50 cuttings only three survived the first year. Much of the failure was probably due to excessive growth of creeping buttercup (Ranunculus repens), which attained heights of three feet, effectively smothering the willows. The following winter small (to 6 feet) alders (Alnus rubra) and aspens (Populus tremuloides) were planted along the creek on the Plaxton property. These have been more successful. The trees and shrubs were planted to provide riparian structure to the creek in an area that had been previously accessed by horses. It is hoped they will also help alleviate any runoff from the burn pile and erosion caused by nearby horses. On Oct 3, 2002, at the Ben Acre pond/weir, Tom Rutherford of DFO (Department of Fisheries and Ocean), Peter McCully of Goldstream Hatchery and their associate redesigned the weir at Ben Acre pond to facilitate fish passage. They added a V-notched stoplog to the weir, raised the height of the original stoplog and added a V-notch. This was not cut quite deep enough and the pond began emptying through a second culvert along the driveway instead of through the weir. They came back on October 24, 2002 and recut the V to a deeper notch. The water now flows through the weir in the such a way as to promote easier access for fish.
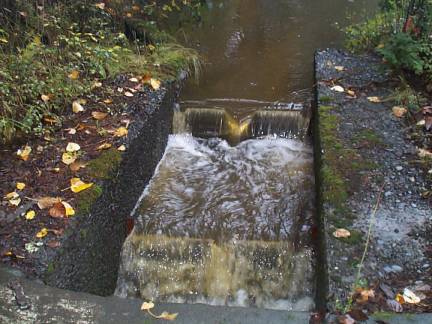 Figure 16 Photo of Redesigned Weir
9. Conclusion
Through benign neglect, long-term ownership of major properties and rural rather than urban development, Gooch Creek and marsh have retained many original ecological values and a small run of blue-listed anadromous coastal cutthroat trout and a population of, blue-listed red legged frog, a rare achievement in a community so close to an urban centre. Habitat quality is deteriorating and it is time to engage the landowners, governments and other organizations in discussions to restore ecosystem health. 10. References AERABI, 2000. Aquatic Ecosystems-Rationale and Background Information. Chapter 8. Biological Indicators. Australia and New Zealand Environmental and Conservation Council and Agriculture and Resource Management Council of Australia and New Zealand, from their website Nov. 8, 2003: http://www.ea.gov.au/water/quality/nwqms/pubs/volume2-8-1.pdf Bauer, W., 1976. Regional Coastal Study, Marine Shore Resource Inventory and Analysis, Western Community Component. Capital Regional District, Victoria. BCAWQG(C), 1998 Edition. British Columbia Approved Water Quality Guidelines (Criteria), from their website on Nov 10, 2003 http://wlapwww.gov.bc.ca/wat/wq/BCguidelines/approved.html#2 Bergner, A., 2003. Environmental Education Coordinator, Capital Regional District. Personal Communication. Chettleberg, P., 2001. Landowner. Personal Communication. Cooper, G., 2003. Proprietor of Metchosin Garage. Personal Communication. Corkran, C.C. and C. Thoms, 1996. Amphibians of Oregon, Washington and British Columbia. A Field Identification Guide. Lone Pine Publishing, Vancouver. Cross, J.W., 2003. The Charms of Duckweed. http://www.mobot.org/jwcross/duckweed/ DIP&NR, 2004. Department of Infrastructure, Planning and Natural Resources, 2004. Algae & Algal Blooms Found in NSW Wetlands. New South Wales. From their website February 18, 2004: http://www.dlwc.nsw.gov.au/care/wetlands/facts/paa/algae/#Causes Duluth Streams. org, March 29, 2004 from their website: http://www.duluthstreams.org/understanding/param_ec.html Edwards, Y. R. (ed)., 1967. Revised 1975. Naturalist’s Guide to the Victoria Region. British Columbia Nature Council and Victoria Natural History Society. Environment Canada, 9/16/2003 http://www.climate.weatheroffice.ec.gc.ca/climate_normals/index_e.html Fletcher, G., 2003. Landowner. Personal Communication. Government of Ontario, 2004. Understanding Stormwater Management: An Introduction to Stormwater Management Planning and Design, 4328e. From their website March 10, 2004: http://www.ene.gov.on.ca/cons/4328.htm Hebda, R., 1996. Atmospheric Change, Forests and Biodiversity. In Press in: Environmental Monitoring and Assessment, Kluwer Publications. 09/20/2003 http://www.rbcm.gov.bc.ca/nh_papers/atmospheric.html Hebda, R., 2003. Curator of Botany and Earth History at Royal British Columbia Museum. Personal Communication. Hinman, C., 2001. Controlling Stormwater the Natural Way. Washington State University. Keddie, G., 1997a. Aboriginal Defensive Sites, Part 2: Amateur Archaeology Begins. 9/23/2003 http://www.rbcm.gov.bc.ca/hhistory/aboriginaldef-sites2.html Keddie, G. 1997b. Aboriginal defensive Sites, Part 3: Modern Archaeologists Collect Evidence. 9/23/2003 http://www.rbcm.gov.bc.ca/hhistory/aboriginaldef-sites3.html Kidd, R.S., 1959. In Devonian Regional Park, A Development Plan, 1982. Parks Division, Capital Regional District. Victoria. Meidinger, D. and J. Pojar, 1991. Ecosystems of British Columbia. Special report series Six. Research Branch, Ministry of Forests. Crown publications, Victoria. Michalski, T.A., G.E. Reid and G.E. Stewart, 2000. Urban Salmon Habitat Program, Assessment Procedures for Vancouver Island. Ministry of Environment, Lands and Parks, Fisheries Section. Nanaimo. National Riparian Service Team. Bureau of Land Management, U.S. Department of Interior. From website on Mach 22, 2004: http://www.mtnvisions.com/Aurora/pfc.html NSDF and DFO, 1994. Adopt-A-Stream Program, Community Based Volunteer Program. Department of Fisheries and Oceans and Nova Scotia Department of Fisheries. Ecologic, Antigonish. Parker, B., 2002. Landowner. Personal Communication. Pauley, G.B., K. Oshima, K.L. Bowers, and G.L. Thomas. 1989. Species Profiles: Life Histories and Environmental Requirements of Coastal Fishes and (Pacific Northwest)–Sea-Run Cutthroat. U.S. Fish Wild. Serv. Biol. Rep. U.S. Army Corps of Engineers TR EL-82-4 Pojar, J. and A. MacKinnon, 1994. Plants of Coastal British Columbia Including Washington, Oregon and Alaska. B.C. Ministry of Forests, Victoria and Lone Pine Publishing, Vancouver. Prichard, D., H. Barrett, J. Cagney, R. Clark, J. Fogg, K. Gebhardt, Dr. P. L. Hansen, B. Mitchell and D. Tippy, 1998 (revised). Riparian Area Management. Process for Assessing proper Functioning Condition (Lotic). Technical reference 1737-9. U.S. Department of the Interior, Bureau of Land Management, Denver, Colorado. RIC, 1998. Resources Inventory Committee, 1998. Province of British Columbia. From their website on March 30, 2004: http://srmwww.gov.bc.ca/risc/pubs/aquatic/interp/interp-01.htm Rose, T., 2004. Frequency of Algal Blooms. WA Waters and Rivers Commission, Australia. From their website: http://www.ozestuaries.org/indicators/In_algal_blooms_f.html Rutherford, T., 2002. Community Advisor, Oceans and Community Stewardship, Fisheries and Oceans Canada. Scott, G.A.J., 1995. Canada’s Vegetation: A World Perspective. McGill-Queen’s University Press. Montreal and Kingston. SFTEMIBC, 1998. Standard for Terrestrial Ecosystem Mapping in British Columbia. Resources Inventory Committee. British Columbia. SHIM Website, 2004. Salmon Habitat Inventory Mapping Website: www.shim.bc.ca/what.html, Feb 22, 2004. Sigma Resource Consultants Ltd., 1979. Summary of Water Quality Criteria for Salmonid Hatcheries. Department of Fisheries and Oceans. Slaney, P.A. and D. Zaldokas (eds.), 1997. Fish Habitat Rehabilitation Procedures. Watershed Restoration Technical Circular No. 9. Watershed Restoration Program, Ministry of Environment, Lands and Parks., Vancouver, British Columbia. Southam, T. and E. A. Curran, (eds.) 1996. The Wetlandkeepers Handbook: A Practical Guide to Wetland Care. B.C. Wildlife Federation, Surrey, B.C. and Environment Canada, Surrey, B.C. Taccogna, G. and K. Munro (eds), 1995. The Streamkeepers Handbook: a Practical Guide to Stream and Wetland Care. Salmonid Enhancement Program, Dept. Fisheries and Oceans, Vancouver, B.C. Weir, R.J., 1983. Footprints. Pioneer Families of the Metchosin District. Southern Vancouver Island 18501-1900. Metchosin School Museum Society. Morriss Printing Company Ltd. Victoria. Wong, S., 2003. Roads Coordinator. District of Metchosin. Personal Communication. Yorath, C.J., and H.W. Nasmith, 1995. Geology of Southern Vancouver Island. A Field Guide. Orca Book Publishers, Victoria.
11. Appendices 1. Ground Inspection Form, Upland Front GIF Upland-Back 2. Ground Inspection Form, Swamp-Front GIF Swamp Back 3. Ground Inspection Form, Marsh GIF Marsh-Back 4. Soil Analysis of Swamp and Marsh January, 2002 5. 1858 Map of Metchosin District 6. Site Visits
Site Visits
|
Date |
Weather |
Comments |
| Oct 2, 2000 | Sun, 15º | Marsh, plant identification |
| Oct 3, 2000 | Sun, 15º | Map creek |
| Oct 12, 2000 | Overcast, calm, 13º | Plant identification |
| Oct 13, 2000 | Overcast, lt rain 13º | Map marsh, vegetation plots |
| Oct 14, 2000 | Cloudy, 13º | Map creek |
| Oct 15, 2000 | Sun, light breeze, 10:30 am, 10º | Water testing |
| Oct 16, 2000 | Cloudy, calm, 12º | Soil pits, Ground Information Forms for upland |
| Oct 17, 2000 | Rain, 12º | Map creek |
| Oct 18, 2000 | Light rain, 12º | Map creek, water quality testing |
| Oct 25, 2000 | Cloudy, 12º, 5pm | Set gee traps |
| Oct 26, 2000 | Calm, 13º, 9am | Collect fish traps |
| Oct. 30, 2000 | Sun, calm, 13º | Re-map lower creek |
| Nov 2, 2000 | Calm, cloudy, 12º | View outlet to Strait |
| July 31, 2001 | Sun/part cloudy, 18º | USHP mapping with Roxie Petts, Louise Ditmar, Joy Williams and Lew Carswell |
| Aug 9, 2001 | Sun, 28º, 11am | USHP mapping with Louise Ditmar, gee trap @ site 1 |
| Aug 12, 2001 | Sun, 20º, 9am | Water quality testing |
| Aug 14, 2001 | Sun, 22º 10:30 am | Invertebrate testing with Louise Ditmar, gee trap @ site 1 |
| Aug 15, 2001 | Sun, 22º 3pm | Check gee trap (no fish), water quality testing |
| Aug 18, 2001 | 22º, clear | Water quality testing |
| Aug 21, 2001 | Cloudy, 20º, noon | Water quality testing and USHP mapping with Gala Milne |
| Aug 23, 2001 | 18º, cloudy | Water samples from Site 3 sent to MB Labs |
| Aug 28, 2001 | Sun/cloudy, 23º, calm, noon | Water quality testing, water samples from Jones Spring and Parker Pond, sent to MB Labs |
| Sept 13, 2001 | 10:30 am, 20º, sun/clouds | Water quality testing |
| Sept 17, 2001 | Cloudy, calm, 15º, 9:15 am-6:00 pm | Water quality testing, set gee traps, collect gee traps |
| Sept 18, 2001 | Cloudy, calm, 18º 9:00 am-3 pm | Collect and set gee traps |
| Sept 27, 2001 | 14º, sun/clouds, 9-11am, 2pm | Invertebrate sampling w/Susan Low water quality testing |
| Oct 1, 2001 | Sun, calm, 19º, noon | Water quality testing |
| Oct 11, 2001 | Sun, light wind, 13º, 1pm | Water quality testing, install depth gauge for site 1 |
| Oct 15, 2001 | Sun/cloudy, calm, 13º | Water quality testing, gee traps |
| Oct 29, 2001 | 9:30am-noon, 9º, cloud/sun | Water quality testing and visit from Don Eastman and Jennifer Sutherst |
| Oct 30, 2001 | Rain, calm, 9º 4-6pm | Water quality testing |
| Nov 13, 2001 | Rain, 8º, 3pm | Water quality testing, ocean water accessing creek |
| Nov 14, 2001 | Rain, 10º, 10am | Water quality testing (TDS- site1) |
| Nov 15, 2001 | Sun, light wind, 11º | Check ocean accessibility, TDS at site1 |
| Nov 19, 2001 | Light rain, 11º 10:30 am | Check site 1 and ocean accessibility |
| Nov 22, 2001 | Cloudy, rain, 9º, 8:30 am | GPS mapping w/Springfield Harrison |
| Nov 23, 2001 | Sun, 10º, 9:40 am | Continue GPS mapping w/Spring |
| Nov 26, 2001 | Sun, calm, 5º, 11 am | Water quality testing |
| Nov 27, 2001 | Light rain, 6º | Water quality testing |
| Dec 3, 2001 | 5º, cloudy | Visit from Tom Davis (Ray Creek), check depth at site 1 |
| Dec 6, 2001 | 9º, cloudy | Check depth at site 1 |
| Dec 12, 2001 | Light rain, 7º | Water quality testing and sample from site 3 sent to MB Labs |
| Dec 14, 2001 | Sun, 9º, huge wind/rain storm previous night | Water quality testing |
| Dec 17, 2001 | 7º, rain, wind | Check access/blocked |
| Dec 20, 2001 | Cloudy, calm, 8º, 2pm | Water quality testing |
| January | Various times | Cut and harvest red osier dogwood and willows from swamp and marsh areas, plant live stakes at Plaxton’s |
| Jan 4, 2002 | Cloudy, calm, 11º, noon | Water quality testing |
| Jan 6, 2002 | Rain, wind, 12º | Check depth at site 1 |
| Jan 21, 2002 | Rain previous night, 5º, 10:30am | Water quality testing, TDS meter battery dead |
| Jan 22, 2002 | Hail, rain, 0º, 10:30am | Water quality testing, site 6 |
| Jan 25, 2002 | 6º, rain | Soil samples from marsh and swamp sent to MB Labs |
| Feb 1, 2002 | Cloudy, calm, 7º, 10:30am | Water quality testing, gee traps, possible trout spawning |
| Feb 9, 2002 | Visit from Tom Davis to check spawning/redds (8 redds) | |
| Feb 12, 2002 | Sun, wind, 2º | Check redds |
| Feb 13, 2002 | Cloudy, calm, 5º | Water quality testing |
| Feb 14, 2002 | Sun, calm, 8), frost in morning | Water quality testing |
| Feb 24, 2002 | Light rain, calm, 5º, 2:30pm | Water quality testing, heavy rain on 22nd |
| Feb 26, 2002 | Sun, cool, calm, noon | Check redds (9?) |
| March | Various times | Plant willows and dogwood at Plaxton’s |
| March 12, 2002 | Cloudy, calm, 10º, 11 am, rain later | Heavy rain on 11th, water quality testing |
| March, 13, 2002 | Rain, 6º | Water quality testing, check redds(12-14) |
| March 27, 2002 | Light rain, calm, 6º, 2:30pm | Water quality testing |
| March 28, 2002 | Sun, calm, 8º, 10:30am | Water quality testing, check redds, some redds larger (multiple spawners?) |
| April 9, 2002 | Light rain, calm, 10º, 11am | Water quality testing |
| April 25, 2002 | Sun, light wind, 16º, 1:45pm | Water quality testing |
| May 8, 2002 | Cloudy, calm, 8º, 10am | Water quality testing, ocean access still possible |
| May 17, 2002 | Sun, light breeze, 13º, 11am | Rain previous evening, water quality testing, 15cm trout in weir |
| May 29, 2002 | 9am-3pm | Visit from Tom Rutherford, Lew and Gloria Carswell, Tom Davis to discuss creek issues, also speak with Peter Chettleburg and Dwight Plaxton |
| June 4, 2002 | Cloudy, calm, 16º, 3 pm | Water quality testing, site 4 extremely turbid, search for fry, check out ecosystem |
| June 12, 2002 | Sun, calm, 20º, 11:30am | Water quality testing, gee traps, angry red-tail hawk! |
| June 13, 2002 | Sun, calm, 20º, 8:30am | Gee traps |
| July 4, 2002 | Cloudy, wind, 14º, 11am | Water quality testing, water sample from site 3 to MB Labs, pH meter broken |
| July 5, 2002 | Water sample sent from site 3 to MB Labs | |
| Sept 9, 2002 | Sun, light wind, 20º, 10am | Water quality testing, now using LaMotte pH kit, remove some purple loosestrife from Parker’s Pond |
| Oct 3, 2002 | 9am | Tom Rutherford, Peter McCullogh and Kelly improve weir by adding stop logs and notching V, to facilitate movement of fish |
| Oct 24, 2002 | Cloudy, calm, 1pm | Tom Rutherford and Kelly “fix” improved weir |
| Nov 7, 2002 | Light rain, calm, 9º, 5pm | Very high tide, saltwater floods marsh, TDS 1930 |
| Jan 8, 2003 | Sun, calm, 4º, 11am | Water quality testing |
| Jan 9, 2003 | Sun, calm, 7º, 11:30am | Water quality testing |
| Jan 22, 2003 | Calm, clouds, cool | Check for redds, possible one |
| Feb 6, 2003 | 1 pm | Meet w/Ian Bruce to dig up alders and aspen |
| Feb 7, 2003 | 11 am | Plant alders and aspens at Plaxton’s |
| Feb 17, 2003 | Sun/cloudy, light wind, 10º, noon | Check depth in marsh, flooded to 30cm depth, take willow cuttings, check redds (possible 10) |
7. Vegetation in Marsh Vegetation surveys were conducted in October 2000 Vegetation in Marsh
| Common Name | Scientific Name | Comments |
| Sea arrow grass |
Triglochin maritimum |
60% toxic, deer eat for salt content |
| Silverweed | Potentilla anserina ssp. pacifica | 5% |
| Cattails | Typha latifolia | 7% |
| Lyngby’s sedge | Carex lyngbyei | 13% |
| Reed canary grass | Phalaris arundinacea | 4% |
| Common reed | Phragmites australis | 4% |
| Spearscale | Atriplex patula | + |
| Spike bentgrass | Agrostis exarata | 7% |
| Quackgrass | Agropyron repens | 1% |
| Meadow barley | Hordeum brachyantherum | + |
| Creeping buttercup | Ranunculus repens | + |
| Willowherb ssp. | Epilobium ssp. | + |
| Pacific water-parsley | Oenanthe sarmentosa | Toxic, 1% |
| Scripus maritimus | Seacoast bulrush | + |
| Coastal pearlwort | Sagina maxima | + |
| Green algae | + | |
| Slough sedge | Carex obnupta | 7% |
| Duckweed | Lemna minor | + |
8. Marsh Transect Marsh Transect Using a young alder tree in the midst of a cattail stand as an endpoint @350º from alder tree (0m) * sedge spp. have very few flowers and grass spp. have lost their flowers, making them difficult to identify
| Distance metres (m) | Plant composition and abundance (%) | Comments |
| 0-23 | 99 cattails + Pacific water parsley | Virginia rail heard, marsh wrens, possible river otter trails |
| 23-40 | 90 Lyngbey’s sedge, 5 Pacific water parsley + cleavers, silverweed, grass (possible Agrostis sp.) | Song sparrow, oily patches on water (water table at surface) |
| @ 38.9 old fence @39.7 ditch | 1m wide, 50 cm. deep, water oily, cover 50% from duckweed and L. sedge, common snipe | |
| 40-49 | 75 sea-arrow grass, 5 silverweed, 2 grass spp. (poss. Agrostis sp.) | |
| @49 ditch | 30cm wide, 15cm. deep, 75% vegetative cover | |
| 49-51.6 | 40 sea-arrow grass, 30 grass sp. | |
| 51.6 ditch | 60 cm. wide, 45cm. deep, 75% vegetative cover, more sedge on edge of ditches | |
| 51.6-57.7 | 40 sea-arrow grass, 10 grass sp., + L. sedge, + silverweed | |
| 57.7 ditch | 40 sea-arrow grass, 10 grass sp., + L. sedge, (more sedge on edge of banks, + silverweed | 40 cm wide, 15cm. deep, No oily substance, 75% vegetative cover, 5 duckweed |
| 57.7-61 | 40 sea-arrow grass, 10 grass sp., 10 L. sedge, + silverweed | |
| 61m ditch | 50 L. sedge, 40 sea-arrow grass, + silverweed | 75% vegetative cover |
| 61-65 | 80 sea-arrow grass, 20 silverweed, + willowherb spp. | |
| 65 ditch | 65 L. sedge, 30 sea-arrow grass | |
| 65-69.7 | 80 sea-arrow grass, 20 silverweed, + willowherb spp. | |
| 69.7 ditch | 65 L. sedge, 30 sea-arrow grass | |
| 69.7-83 | 80 sea-arrow grass, 20 silverweed, + willowherb spp. | @83 m is walkway |
| 83-90 | 60 L. sedge, 30 grass ssp. (15 possible Agrostis sp., 15 Agropyron repens), 5 silverweed | |
| 90 ditch | 75% vegetative cover, 75% L. sedge | 30cm. wide, 15cm. deep |
| 90- 101.5 (by young alder tree) | 50 L. sedge, 10 grass sp. + silverweed, 20 reed canary grass | Marsh wren, Bewick’s wren, lg. blue dragonflies, smaller red dragonflies |
| 101.5 creek | 10% cover, + common rush, + grass sp. (fescue?), 5 L. sedge, + meadow barley, + sea-arrow grass, + silverweed | 1.3m wide, 62.5 cm. wide, oily |
| 101.5-110 | L. sedge | |
| 110- 133 | 20 silverweed , 20 grasses and sedges, 4 sea arrow, | unidentified grasses, possible slough sedge |
| 133 | ditch | |
| 134-190 | 60 silverweed, 20 slough sedge, + sea arrow grass, + Pacific water parsley, + spearscale, + reed canary grass | |
| 190-110 | 80 slough sedge, 15 unidentified grass | Old fence @ 190 |
| 110+ | Alder/skunk cabbage swamp |
9. Shrub vegetation at Marsh edge Shrub Vegetation at Marsh Edge
| Common Name | Scientific Name | Comments |
| Pacific crabapple |
Malus fusca |
|
| Hooker’s Willow | Salix hookeriana. | |
| Red-osier dogwood | Cornus stolonifera | |
| Pacific ninebark | Physocarpus capitatus | |
| Red alder | Alnus rubra | |
| Nootka rose | Rosa nootkana | |
| Indian plum | Oemleria cerasiformis | |
| Salmonberry | Rubus spectabilis | |
| Bitter cherry | Prunus emarginata |
Dense shrubs with lots of songbirds, provides excellent erosion control and habitat 10. Vegetation in Swamp
Vegetation in Swamp
| Common Name | Scientific Name | Comments |
| Red alder |
Alnus rubra |
Provides 65% crown cover |
| Skunk cabbage | Lysichiton americanum | Provides 75-90% cover in spring and summer, |
| Lady fern | Athyrium filix-femina | 1% |
| Holly | Ilex sp. | Introduced, invasive |
| Slough sedge | Carex obnupta | Trace |
| Sedge sp. possible Henderson’s sedge | Carex hendersonii | Trace |
| Creeping buttercup | Ranunculus repens | Trace, introduced, invasive |
| Salmonberry | Rubus spectibilis | Trace |
Also seen within the marsh and swamp: black-tailed deer (Odocoileus lemionus), red-legged frog (Rana aurora), Pacific tree frog (Hyla regilla), the body of a possible muskrat (Ondatra zibethicus), and western gray squirrel (Sciurus griseus). The marsh is inhabited by a family of river otters (Lutra canadensis) (pers. comm. P. Chettlebergh) and there are bats which frequent the marsh (pers. comm. G. Fletcher). 11. Vegetation Surrounding Ben Acre Pond Vegetation Surrounding Ben Acre Pond
| Common name | Scientific name | Comments |
| Baldhip rose |
Rosa gymnocarpa |
|
| Douglas fir | Psuedotsuga menziesii | |
| Bigleaf maple | Acer macrophyllum | |
| Grand fir | Abies grandis | |
| Elderberry | Sambucus racemosa | |
| Oceanspray | Holodiscus discolor | |
| Salmonberry | Rubus spectabilis | |
| Indian plum | Oemleria cerasiformis | |
| Himalayan blackberry | Rubus discolor | Introduced, invasive |
| Snowberry | Symphoricarpos albus | |
| Western sword fern | Polystichum munitum | |
| Bracken | Pteridium aquilinum | |
| Evergreen blackberry | Rubus laciniatus | Introduced, invasive |
| Trailing blackberry | Rubus ursinus | |
| Daphne | Daphne laureola | Introduced, invasive |
| Gorse | Ulex europaeus | Introduced, invasive |
| Narrow-leafed Oregon grape | Mahonia nervosa | |
| Alaska oniongrass |
Melica subulata |
|
| Western fescue | Festuca occidentalis | |
| Moss sp., possible electrified cat’s tail | Rhytidiadelphus triquetrus | 70% cover |
| Orchard grass | Dactylis glomerata | Trace, introduced |
| Northern mannagrass | Glyceria borealis | Patch at creek inlet |
| Small-flowered bulrush | Scripus microcarpus | Patch at creek inlet |
| Grass sp. possible red fescue | Festuca rubra | Patch at creek inlet |
12. USHP Data Reach 1-6
USHP Data Part One
| Stream Name | Gooch Creek | Watershed Code | |||||||||||
| Habitat Parameter | Reach one |
Ratings |
Reach two |
Ratings |
Reach three |
Ratings |
Reach four |
Ratings |
Reach five |
Ratings |
Reach 6 |
Ratings |
Total |
| % Pool Area | 150.00 |
1 |
100.00 |
1 |
59.30 |
1 |
55.75 |
1 |
58.78 |
1 |
65.05 |
1 |
6 |
| Large Woody Debris/Bankfull Channel Width | 0.38 |
5 |
0.00 |
5 |
1.73 |
3 |
0.12 |
5 |
0.07 |
5 |
0.18 |
5 |
28 |
| % Cover in Pools | 48 |
1 |
0 |
5 |
5 |
5 |
15 |
3 |
60 |
1 |
3 |
5 |
20 |
| Average% Boulder Cover | 0 |
5 |
0 |
5 |
0 |
5 |
10 |
3 |
0 |
5 |
0 |
5 |
28 |
| Average % Fines | 100.00 |
5 |
100.00 |
5 |
100.00 |
5 |
5.00 |
1 |
5.00 |
1 |
39.00 |
5 |
22 |
| Average % Gravel | 0.00 |
not rated |
0.00 |
not rated |
0.00 |
not rated |
35.00 |
not rated |
95.00 |
not rated |
50.00 |
not rated |
— |
| % of Reach Eroded | 0 |
1 |
0 |
1 |
0 |
1 |
0 |
1 |
1 |
1 |
3 |
1 |
6 |
| Obstructions | 0 |
0 |
0 |
0 |
0 |
0 |
0 |
0 |
0 |
0 |
5 |
5 |
5 |
| % of Reach Altered | 0 |
1 |
100 |
5 |
0 |
1 |
0 |
1 |
0 |
1 |
0 |
1 |
10 |
| % Wetted Area | 11.32 |
5 |
73.19 |
3 |
7.68 |
5 |
86.88 |
3 |
36.51 |
5 |
42.17 |
5 |
26 |
| Dissolved Oxygen | 5.00 |
3 |
8.30 |
1 |
7.30 |
1 |
8.30 |
1 |
8.40 |
1 |
7.40 |
1 |
8 |
| pH | 7.50 |
1 |
7.30 |
1 |
7.20 |
1 |
7.40 |
1 |
7.90 |
1 |
7.50 |
1 |
6 |
| Totals |
28 |
32 |
28 |
20 |
22 |
35 |
165 |
||||||
| Off-Channel Habitat as % of Reach | 0 |
5 |
0 |
5 |
0 |
5 |
0 |
5 |
0 |
5 |
2 |
5 |
30 |
| Reach Lengths | 277 |
not rated |
65 |
not rated |
132 |
not rated |
17 |
not rated |
202 |
not rated |
202 |
not rated |
894.4 |
| Fish Data | |||||||||||||
| Reach |
Reach one |
Ratings |
Reach two |
Ratings |
Reach three |
Ratings |
Reach four |
Ratings |
Reach five |
Ratings |
Reach 6 |
Ratings |
Total |
| Fry Capacity |
831 |
— |
2662 |
— |
288 |
— |
44 |
— |
520 |
— |
396 |
— |
4741 |
| Actual Pop. |
0.00 |
0.00 |
0.00 |
0.00 |
0.00 |
0.00 |
0 |
||||||
| Fry Densities | |||||||||||||
| Species | Coho |
Ratings |
Coho |
Ratings |
Coho |
Ratings |
Coho |
Ratings |
Coho |
Ratings |
Coho |
Ratings |
Total |
| Site One |
0 |
||||||||||||
| Site Two |
0 |
||||||||||||
| Species | |||||||||||||
| Site One |
0 |
||||||||||||
| Species | |||||||||||||
| Site Two |
0 |
||||||||||||
| Species | |||||||||||||
| Site One |
0 |
||||||||||||
| Species | |||||||||||||
| Site Two |
0 |
||||||||||||
| Riparian Ratings | |||||||||||||
| Reach |
Reach one |
Ave. Ratings |
Reach two |
Ave. Ratings |
Reach three |
Ave. Ratings |
Reach four |
Ave. Ratings |
Reach five |
Ave. Ratings |
Reach 6 |
Ave. Ratings |
Total |
| Land Use |
8 |
1 |
2 |
1 |
2 |
1 |
2 |
1 |
4 |
1 |
14 |
4 |
9 |
| Riparian Slope |
6 |
1 |
2 |
1 |
2 |
1 |
2 |
1 |
4 |
1 |
4 |
1 |
6 |
| Bank Stability |
6 |
1 |
2 |
1 |
2 |
1 |
2 |
1 |
4 |
1 |
10 |
3 |
8 |
|
Ratings |
Ratings |
Ratings |
Ratings |
Ratings |
Ratings |
— |
|||||||
| % Crown Cover | 35.00 |
5 |
10.00 |
5 |
85.00 |
1 |
55.00 |
3 |
80.00 |
1 |
85.00 |
1 |
16 |
| % of Reach Accessed by Livestock |
0 |
0 |
0 |
0 |
0 |
0 |
0 |
0 |
0 |
0 |
12 |
3 |
3 |
| Average Vegetation Depth |
21.5 |
5 |
30 |
3 |
30 |
3 |
30 |
3 |
30 |
3 |
30 |
3 |
20 |
| Totals |
|
13 |
|
11 |
|
7 |
|
9 |
|
7 |
|
14 |
61 |
13. USHP Data Reach 7-11
| Stream Name | Gooch Creek | Watershed Code | |||||||||||
| Habitat Parameter | Reach 7 |
Ratings |
Reach 8 |
Ratings |
Reach 9 |
Ratings |
Reach 10 |
Ratings |
Ratings |
Ratings |
Total |
||
| % Pool Area | 43.62 |
3 |
11.88 |
5 |
57.57 |
1 |
44.60 |
3 |
12 |
||||
| Large Woody Debris/Bankfull Channel Width | 0.00 |
5 |
0.00 |
5 |
0.00 |
5 |
0.00 |
5 |
20 |
||||
| % Cover in Pools | 0 |
5 |
0 |
5 |
2 |
5 |
61 |
1 |
16 |
||||
| Average% Boulder Cover | 0 |
5 |
0 |
5 |
0 |
5 |
0 |
5 |
20 |
||||
| Average % Fines | 80.00 |
5 |
100.00 |
5 |
100.00 |
5 |
15 |
||||||
| Average % Gravel | 20.00 |
not rated |
0 |
not rated |
0.00 |
not rated |
0.00 |
not rated |
not rated |
not rated |
— |
||
| % of Reach Eroded | 0 |
1 |
0 |
1 |
0 |
1 |
25 |
5 |
8 |
||||
| Obstructions | 0 |
0 |
0 |
0 |
0 |
0 |
0 |
0 |
0 |
||||
| % of Reach Altered | 13 |
5 |
0 |
1 |
58 |
5 |
144 |
5 |
16 |
||||
| % Wetted Area | 97.50 |
1 |
77.78 |
3 |
100.00 |
1 |
63.64 |
5 |
10 |
||||
| Dissolved Oxygen | 4.20 |
5 |
. | 11.00 |
1 |
8.00 |
1 |
. | . |
7 |
|||
| pH | 7.60 |
1 |
9.40 |
5 |
7.00 |
1 |
7 |
||||||
| Totals |
36 |
25 |
34 |
36 |
0 |
0 |
131 |
||||||
| Off-Channel Habitat as % of Reach | 0 |
5 |
0 |
5 |
0 |
5 |
0 |
5 |
20 |
||||
| Reach Lengths | 42 |
not rated |
86 |
not rated |
70 |
not rated |
181 |
not rated |
not rated |
not rated |
377.8 |
||
| Fish Data | |||||||||||||
| Reach |
Reach 7 |
Ratings |
Reach 8 |
Ratings |
Reach 9 |
Ratings |
Reach 10 |
Ratings |
Ratings |
Ratings |
Total |
||
| Fry Capacity |
61 |
— |
150 |
— |
8873 |
— |
380 |
— |
— |
— |
9462 |
||
| Actual Pop. |
0.00 |
0.00 |
0.00 |
0.00 |
0 |
||||||||
| Fry Densities | |||||||||||||
| Species | Coho |
Ratings |
Coho |
Ratings |
Coho |
Ratings |
Coho |
Ratings |
Coho |
Ratings |
Coho |
Ratings |
Total |
| Site One |
0 |
||||||||||||
| Site Two |
0 |
||||||||||||
| Species | |||||||||||||
| Site One |
0 |
||||||||||||
| Species | |||||||||||||
| Site Two |
0 |
||||||||||||
| Species | |||||||||||||
| Site One |
0 |
||||||||||||
| Species | |||||||||||||
| Site Two |
0 |
||||||||||||
| Riparian Ratings | |||||||||||||
| Reach |
Reach 7 |
Ave. Ratings |
Reach 8 |
Ave. Ratings |
Reach 9 |
Ave. Ratings |
Reach 10 |
Ave. Ratings |
Ave. Ratings |
Ave. Ratings |
Total |
||
| Land Use |
8 |
4 |
8 |
4 |
6 |
3 |
48 |
5 |
16 |
||||
| Riparian Slope |
2 |
1 |
2 |
1 |
8 |
1 |
3 |
||||||
| Bank Stability |
4 |
2 |
2 |
1 |
2 |
1 |
22 |
2 |
6 |
||||
|
Ratings |
Ratings |
Ratings |
Ratings |
Ratings |
Ratings |
— |
|||||||
| % Crown Cover | 85.00 |
1 |
90.00 |
1 |
0.00 |
5 |
0.00 |
5 |
12 |
||||
| % of Reach Accessed by Livestock |
0 |
0 |
0 |
0 |
0 |
0 |
666 |
5 |
5 |
||||
| Average Vegetation Depth |
11 |
5 |
8 |
5 |
30 |
3 |
25 |
5 |
18 |
||||
| Totals |
|
13 |
|
12 |
|
12 |
|
23 |
|
0 |
|
0 |
60 |
Ed Note: The following appendices were not added to this version of the report.
14. PFC Reach One-Front Reach 1 Back 15. PFC Reach Two-Front Reach 2-Back 16. PFC Reach Three-Front Reach 3-Back 17. PFC Reach Four-Front Reach 4-Back PFC Reach Five-Front Reach Five-Back 19. PFC Reach Six-Front Reach Six-Back 20. PFC Reach Seven-Front Reach Seven-Back 21. PFC Reach Eight-Front Reach Eight-Back 22. Air Photo 1926 23. Air Photo 1970 24. Fecal Coliform Testing (Winter, 2001) 25. Fecal Coliform Testing (Summer, 2001) 26. Chemical Analysis of Water Summer, 2001 27. Chemical Analysis of Water Winter, 2001 28. Nitrogen Levels in Gooch Creek-August 2001 29. Nitrogen Levels in Gooch Creek, December, 2001 30. Soil Particle Size and Organic Content-Swamp and Marsh 31. Parker’s Pond Alkalinity Testing \ 32. Jone’s Spring Fecal Coliform Levels 33. Wetland Survey-TR1-QU1 34. Wetland Survey-TR1-QU2
- Wetland Survey-TR2-QU1
- Wetland Survey-TR2-QU2
- Wetland Survey-TR3-QU1
- Wetland Survey-TR3-QU2