
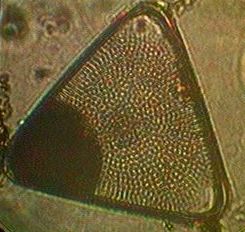
Triceratops
BACKGROUND: Microscopic plankton can be can be collected in a way that allows us to determine densities of the organisms, and therefore compare different pelagic environments. We have already seen how plankton populations can vary from part of the ocean to another. In order to quantify plankton, the following method is suggested. You are urged to come up with your own research problem concerning plankton populations and then proceed to use the following techniques to investigate. Although this lab refers to Pedder Bay on Vancouver Island,, It could be modified to suit any location.PROCEDURE:In order to determine densities of organisms, we first have to know the volume of the water from which the sample is taken.
1. Calibrating the log:
-
- You will use a plankton net with a small propellor driven counting log to measure distance travelled in the water that is sampled. To calibrate the log, measure off a distance on the docks, read the dial at the beginning of the trial, drag it through the water the length of the measured section, and the difference in the reading at the end of your tow will be the length of your cylinder of water.
- Now calculate how many counts on the dial there are per meter.
- Divide the number of counts per meter into the number of counts through the distance you drag the net for your sample. This gives you a number of meters in length for the sample cylinder.
- Measure the diameter of the net opening and now calculate the volume of sample taken from the open ocean. The formula for volume of a cylinder is V=(pi X radius squared) X h(meters)
3. What is in The sample?
-
-
- Note the total volume of the sample traken. Then remove a representative subsample of 1 ml.
- Place the 1ml sample in a slide with a measured viewing chamber. Count numbers of individual species in representative quadrats. Obtain the average, and multiply this number by the total number of quadrats available.
-
4. Density determination.
-
-
- .Now calculate the density of the individual species in the sample . i.e. number per cubic cm. then per cubic meter.
-
5. Option :
-
- Calculate the number for a larger area e.g. Pedder Bay ! Hint treat it as a segment of a cone for volume determinations, use a chart to determine the measurements of the bay..
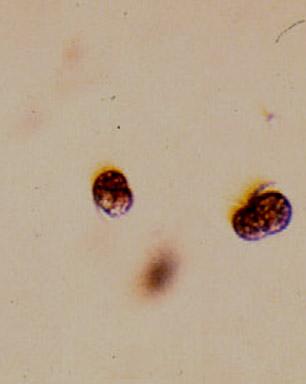 Pedder Bay frequently has booms of Mesodinium rubrum. This organism turns the bay a deep wine color . It is not a poisonous red tide , but we have noticed that when it is pumped up into seawater tanks, it will easily smother some of the filter feeders such as sponges. Blooms often coincide with nutrient loading followed by a period of sunny weather.
-
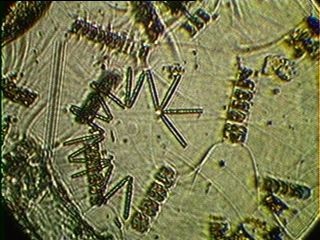
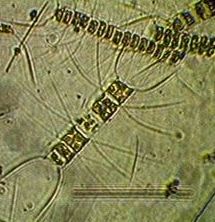
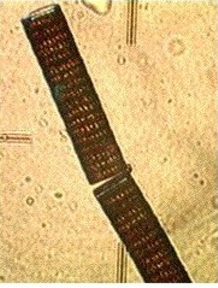
- Thalassionema
-
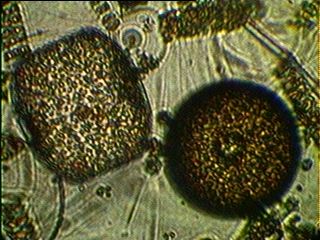
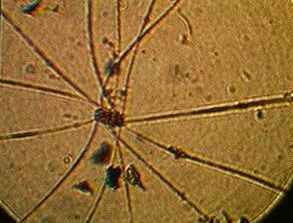
- Coscinodiscus
-
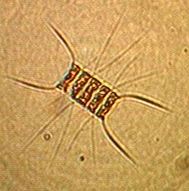
- Chaetocerous
-
- Chaetocerous end view
-
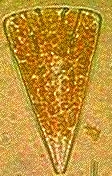
- Triceratops
-
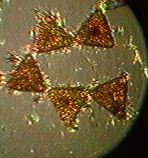
- Triceratops
-
- Licmorpha
-
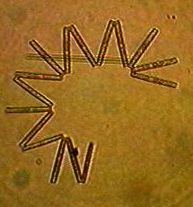
- Thalassionema