Over the past year a volunteer group has worked with CRD Parks staff to restore some of the sensitive habitat at Witty’s beach and lagoon.
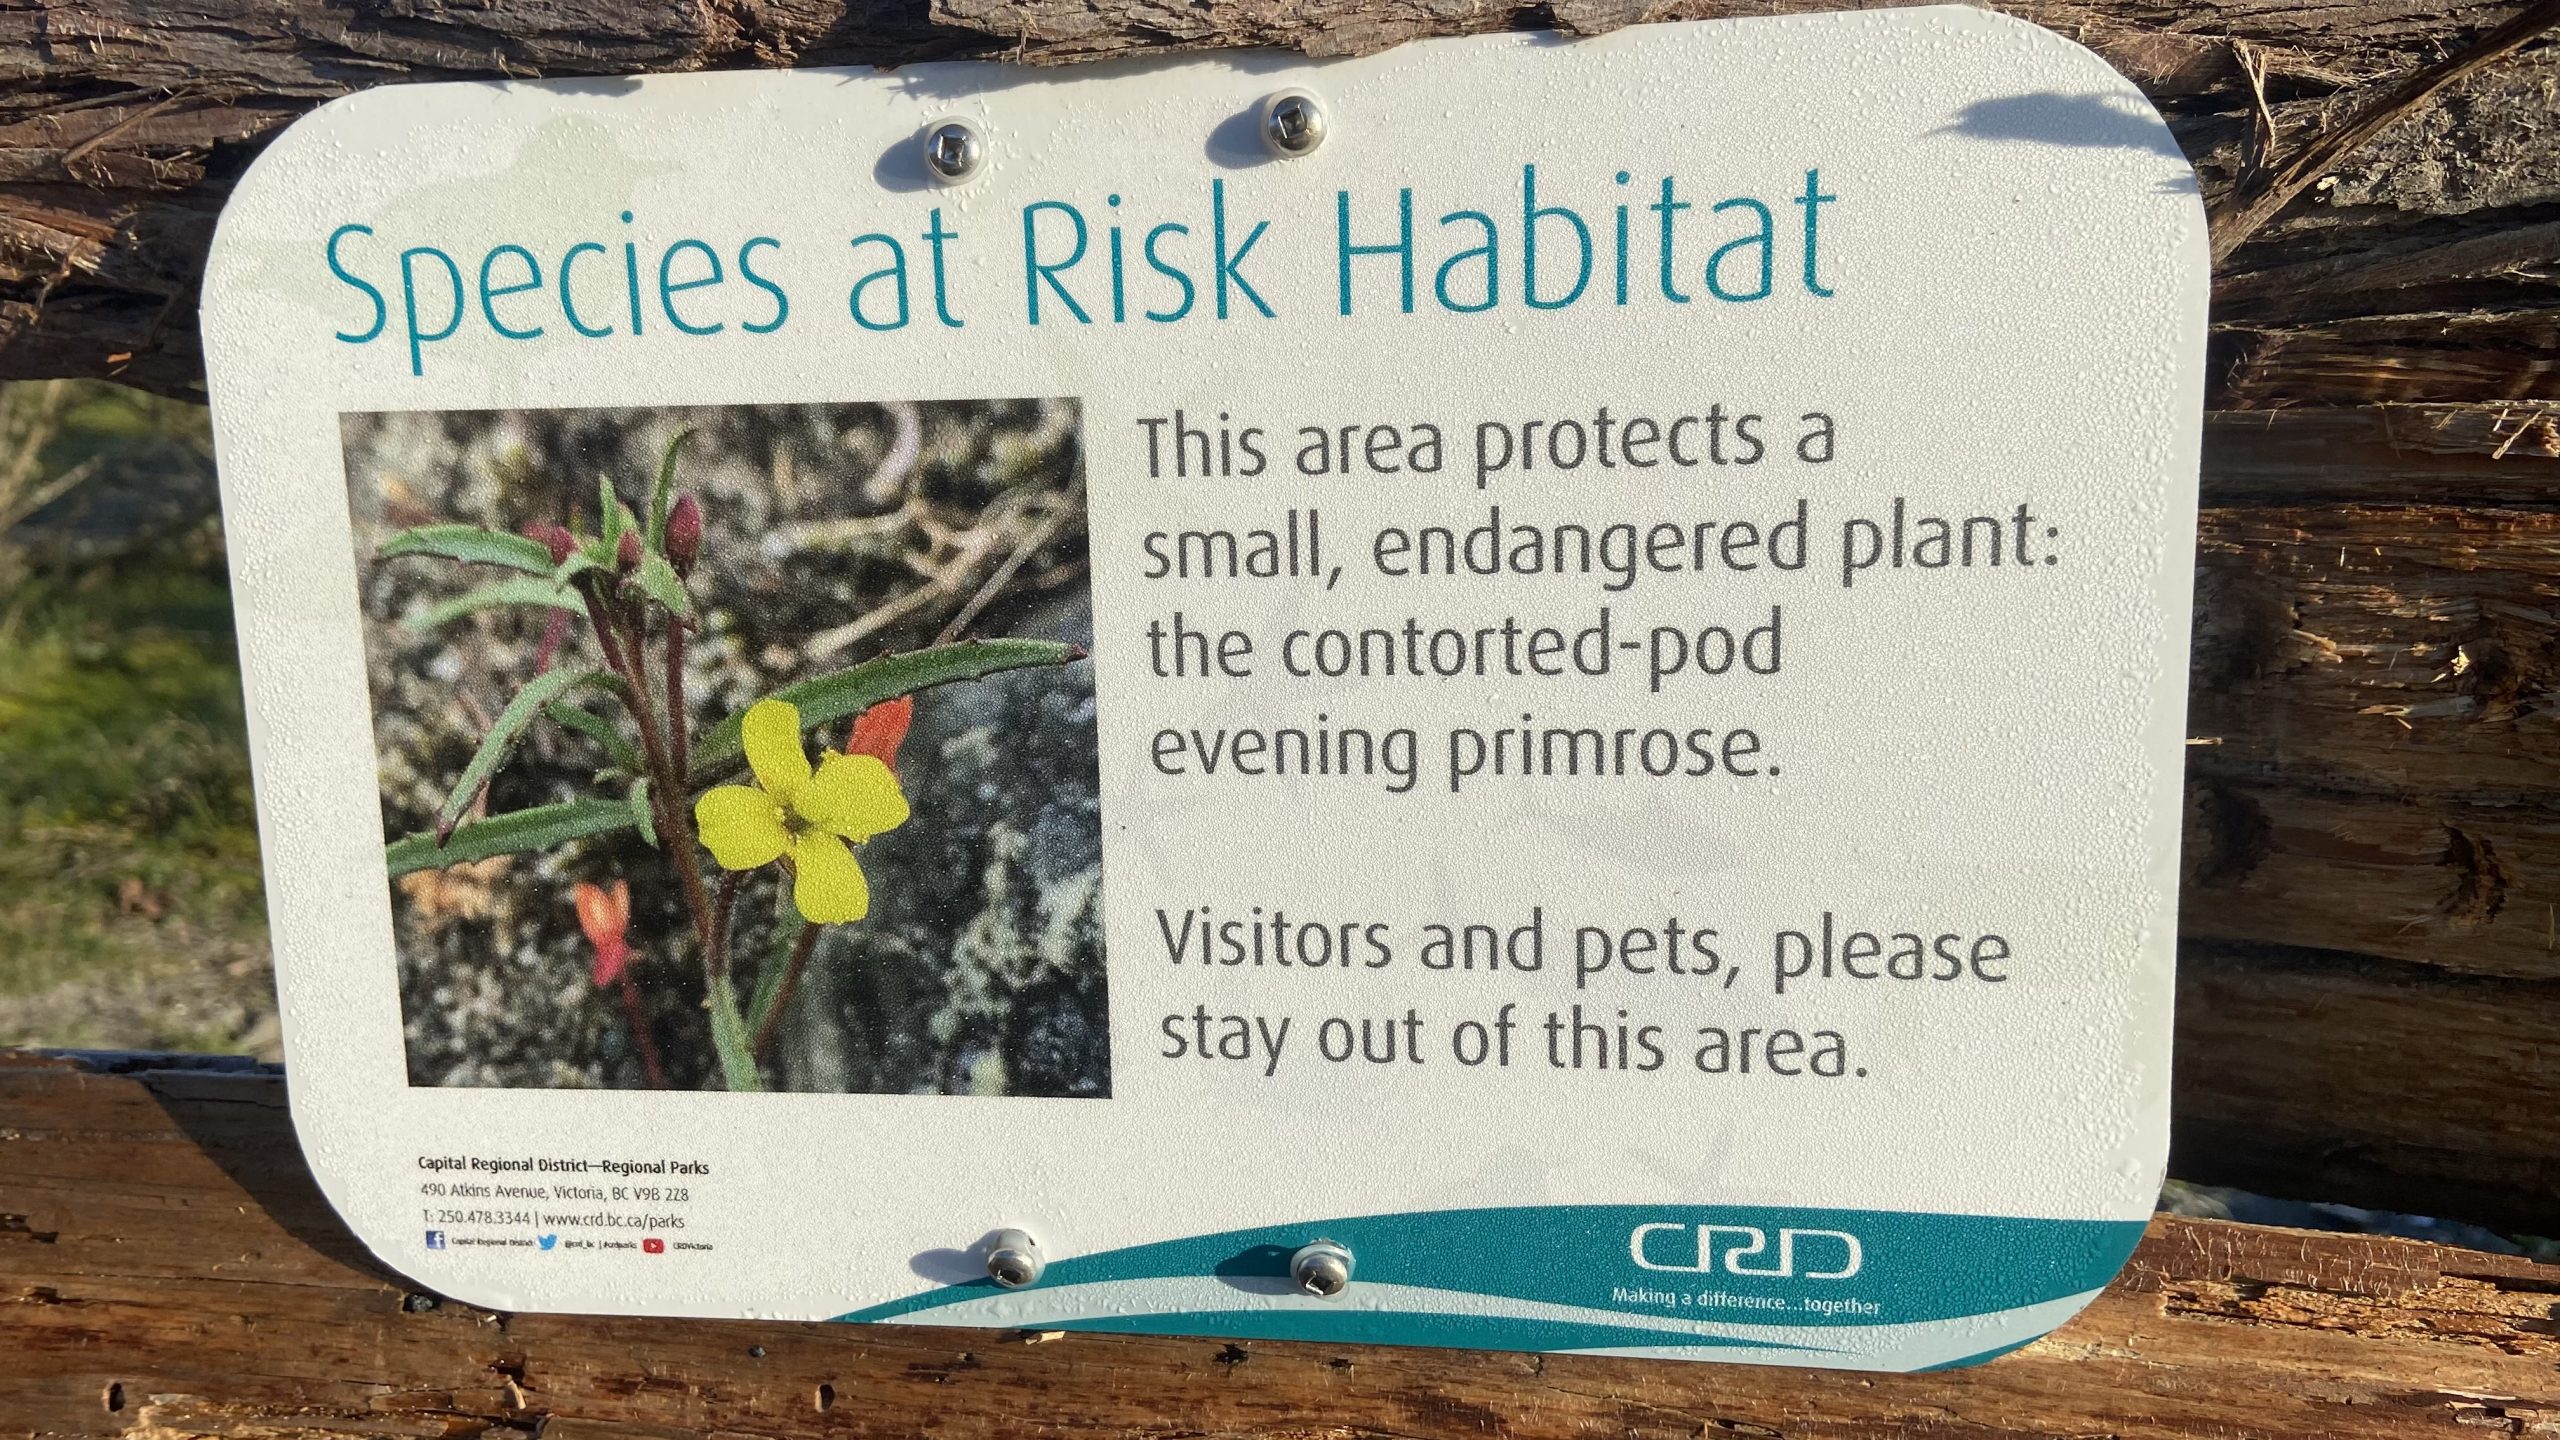
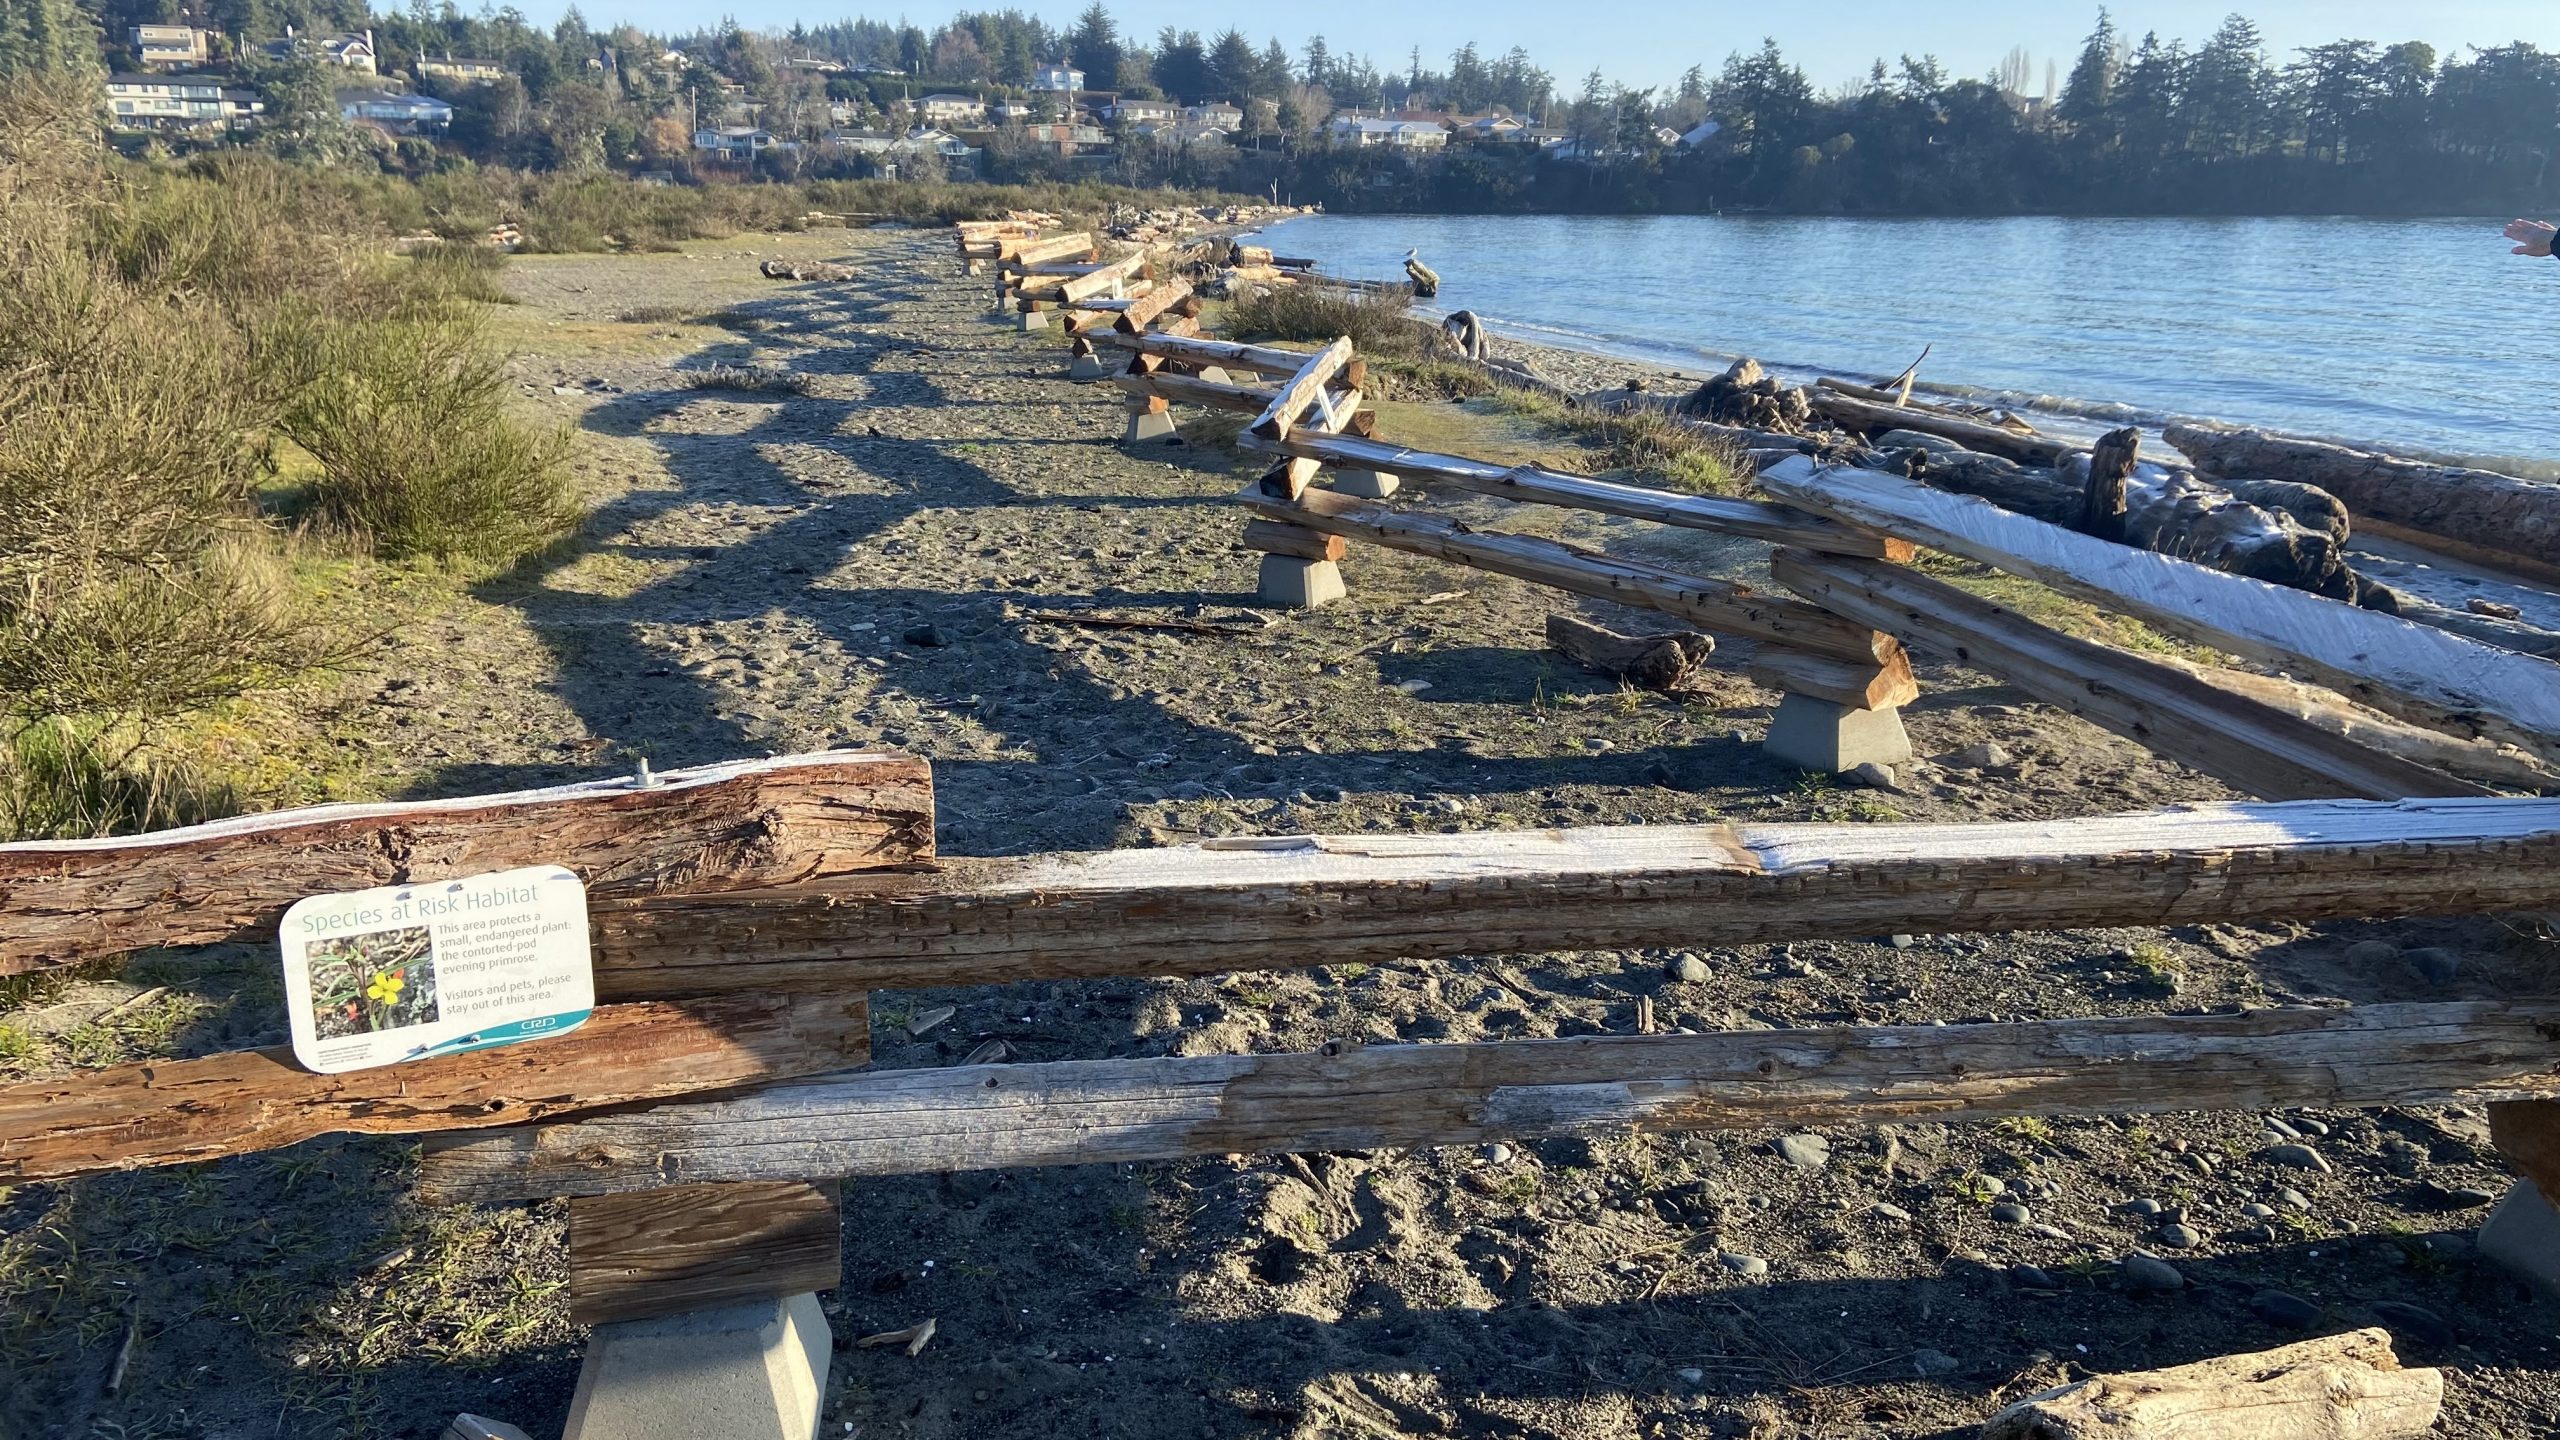
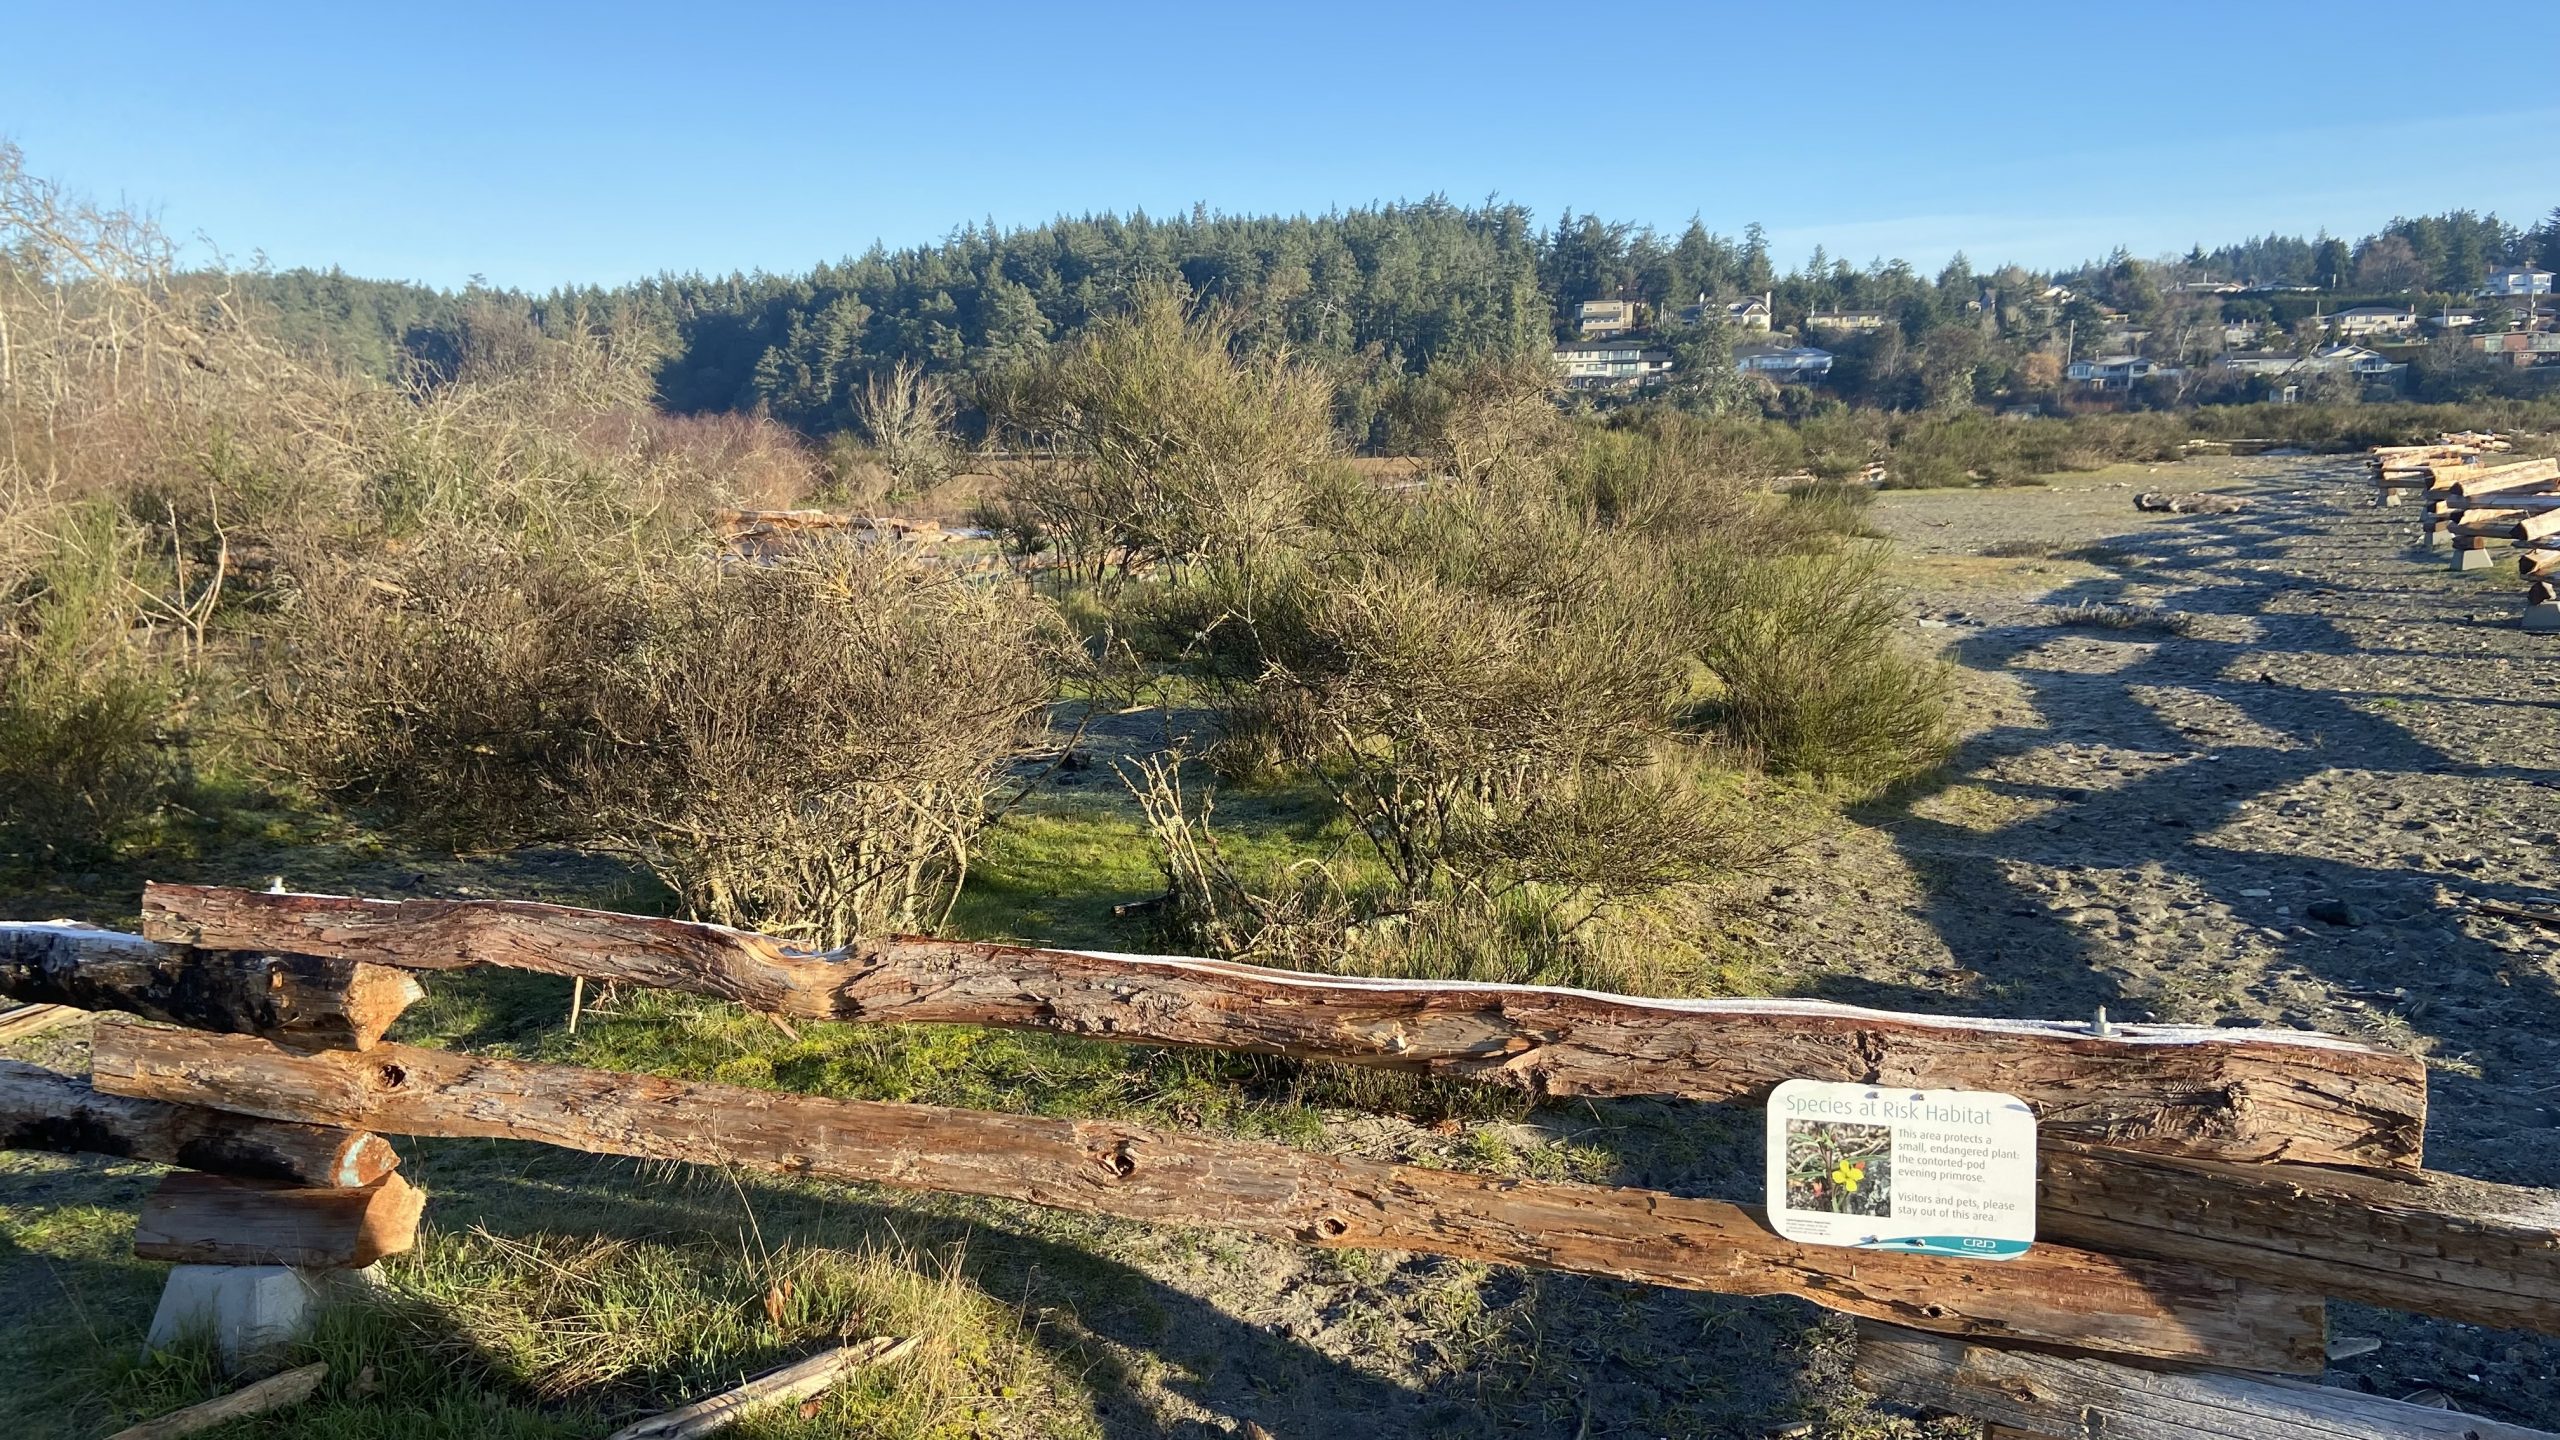
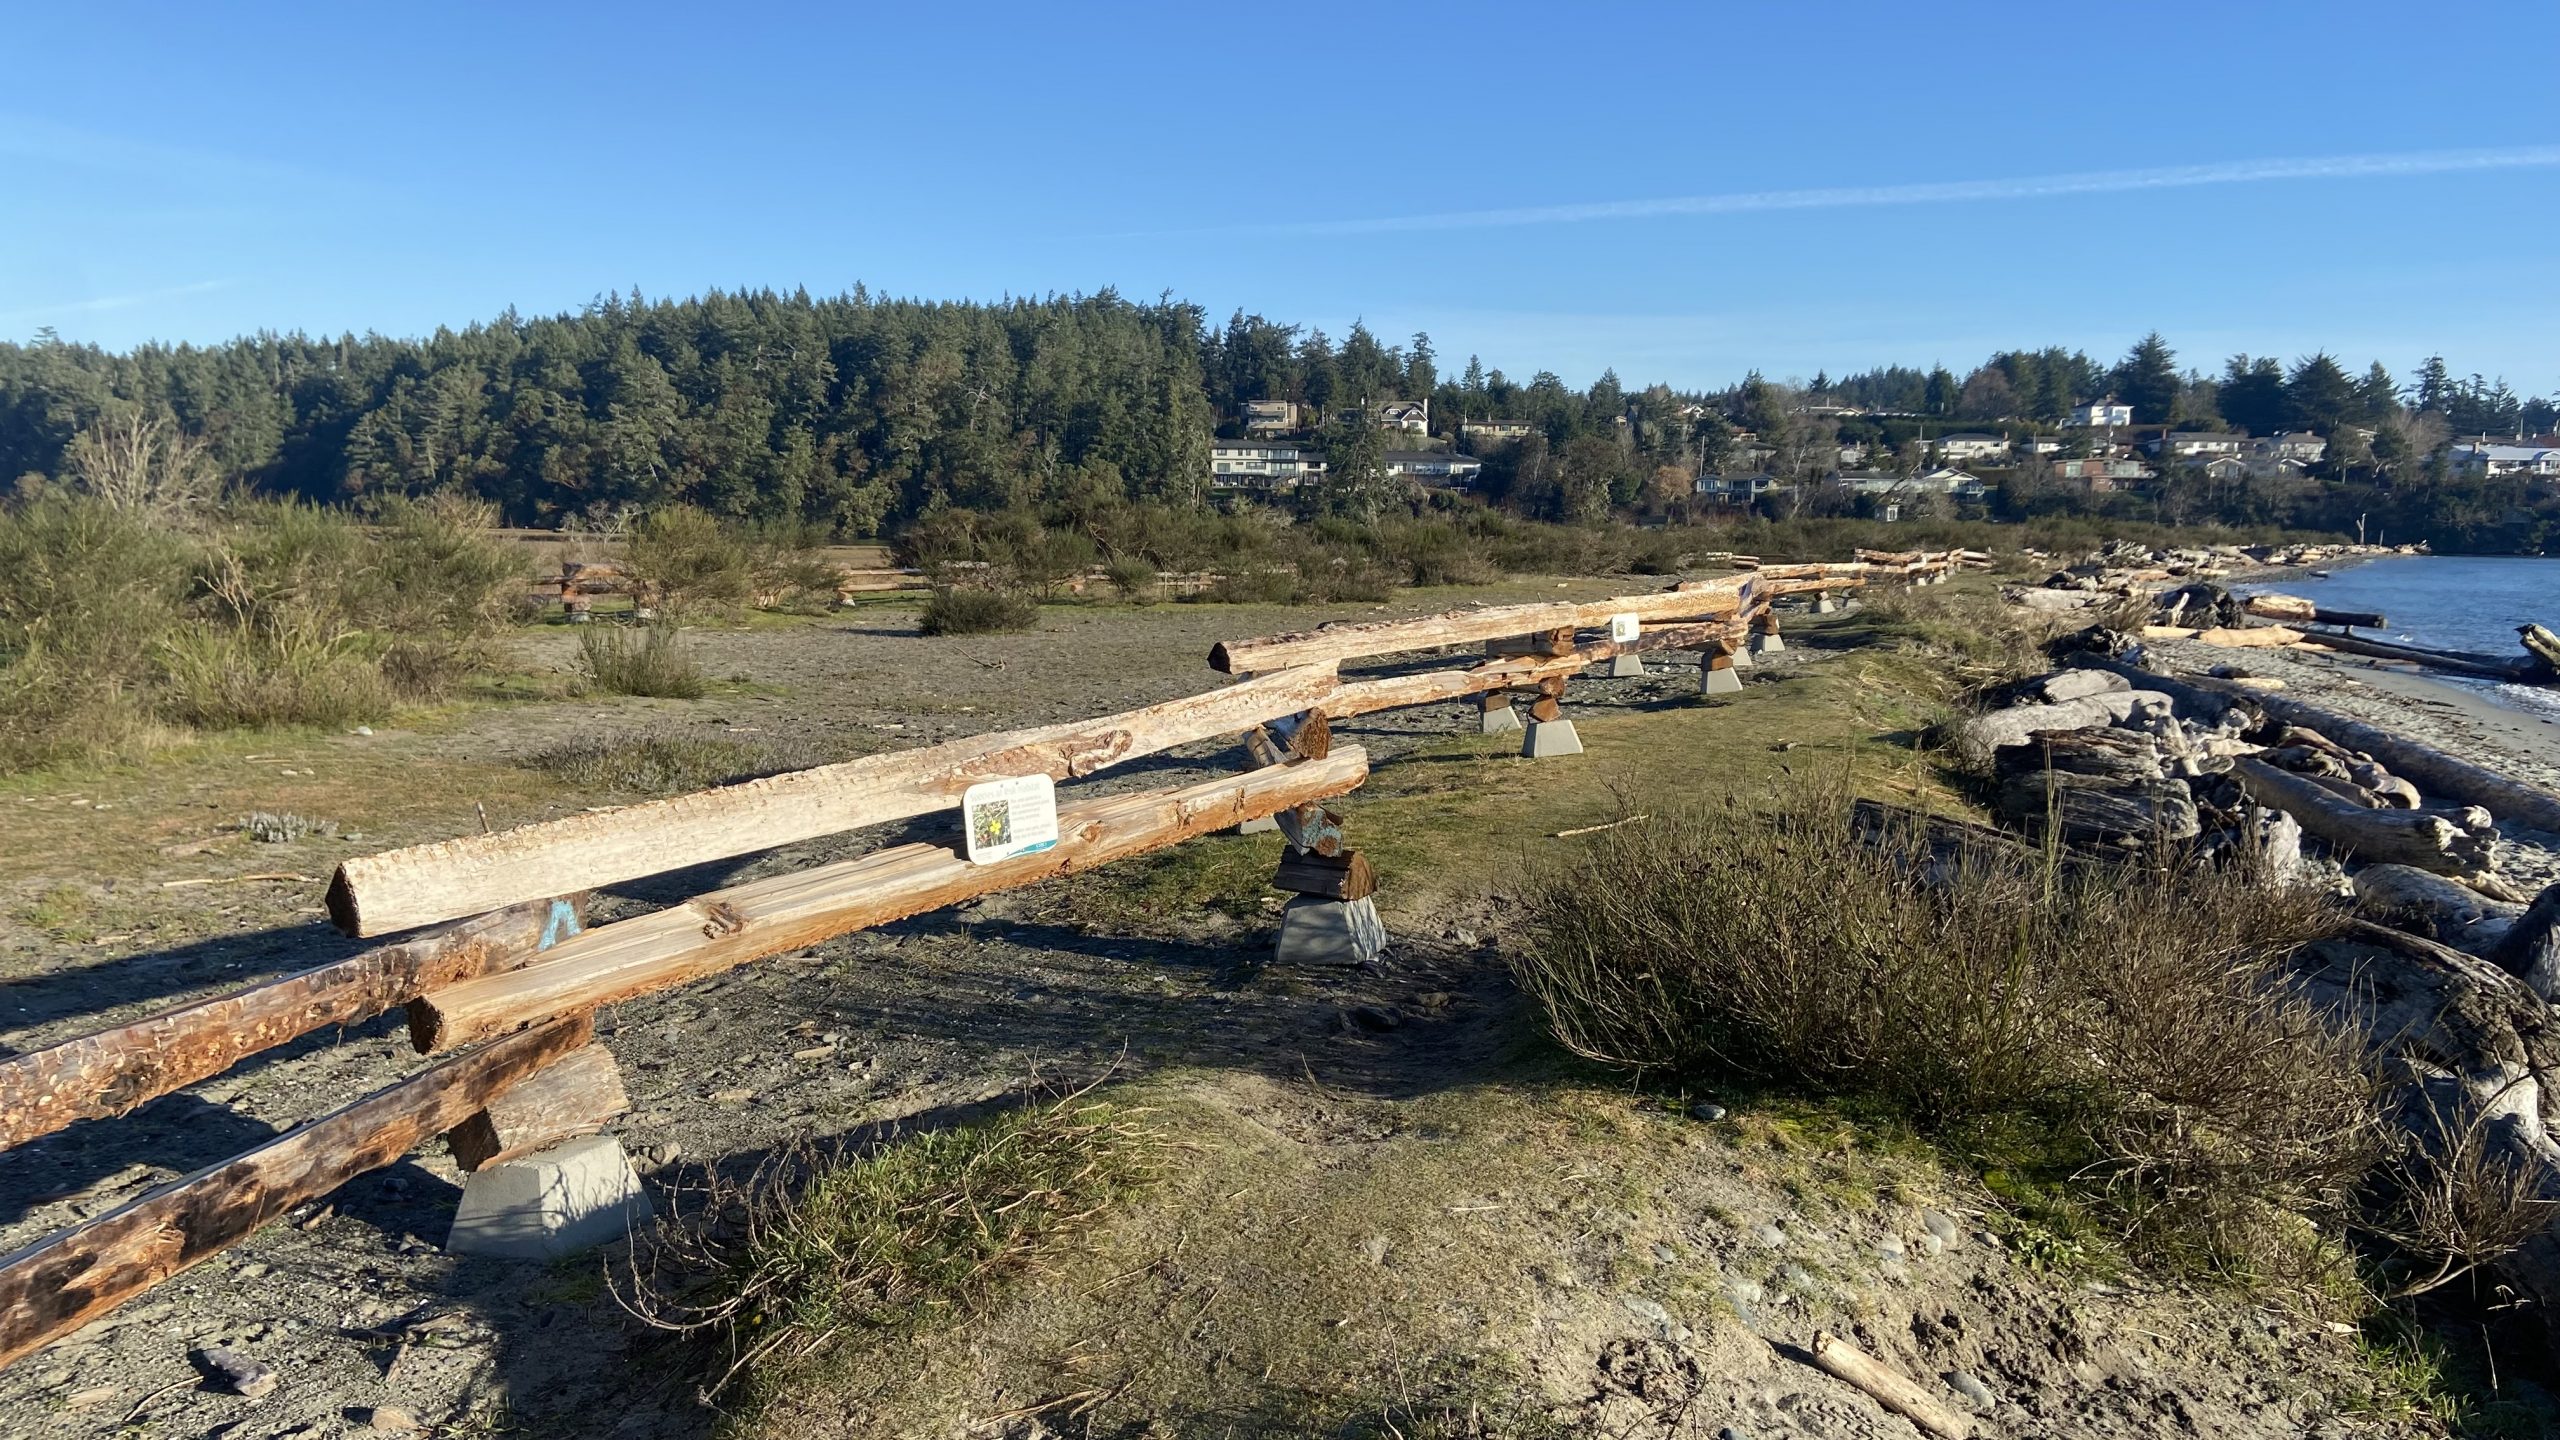
It is important to observe the signage and avoid walking in this area.
Over the past year a volunteer group has worked with CRD Parks staff to restore some of the sensitive habitat at Witty’s beach and lagoon.
It is important to observe the signage and avoid walking in this area.
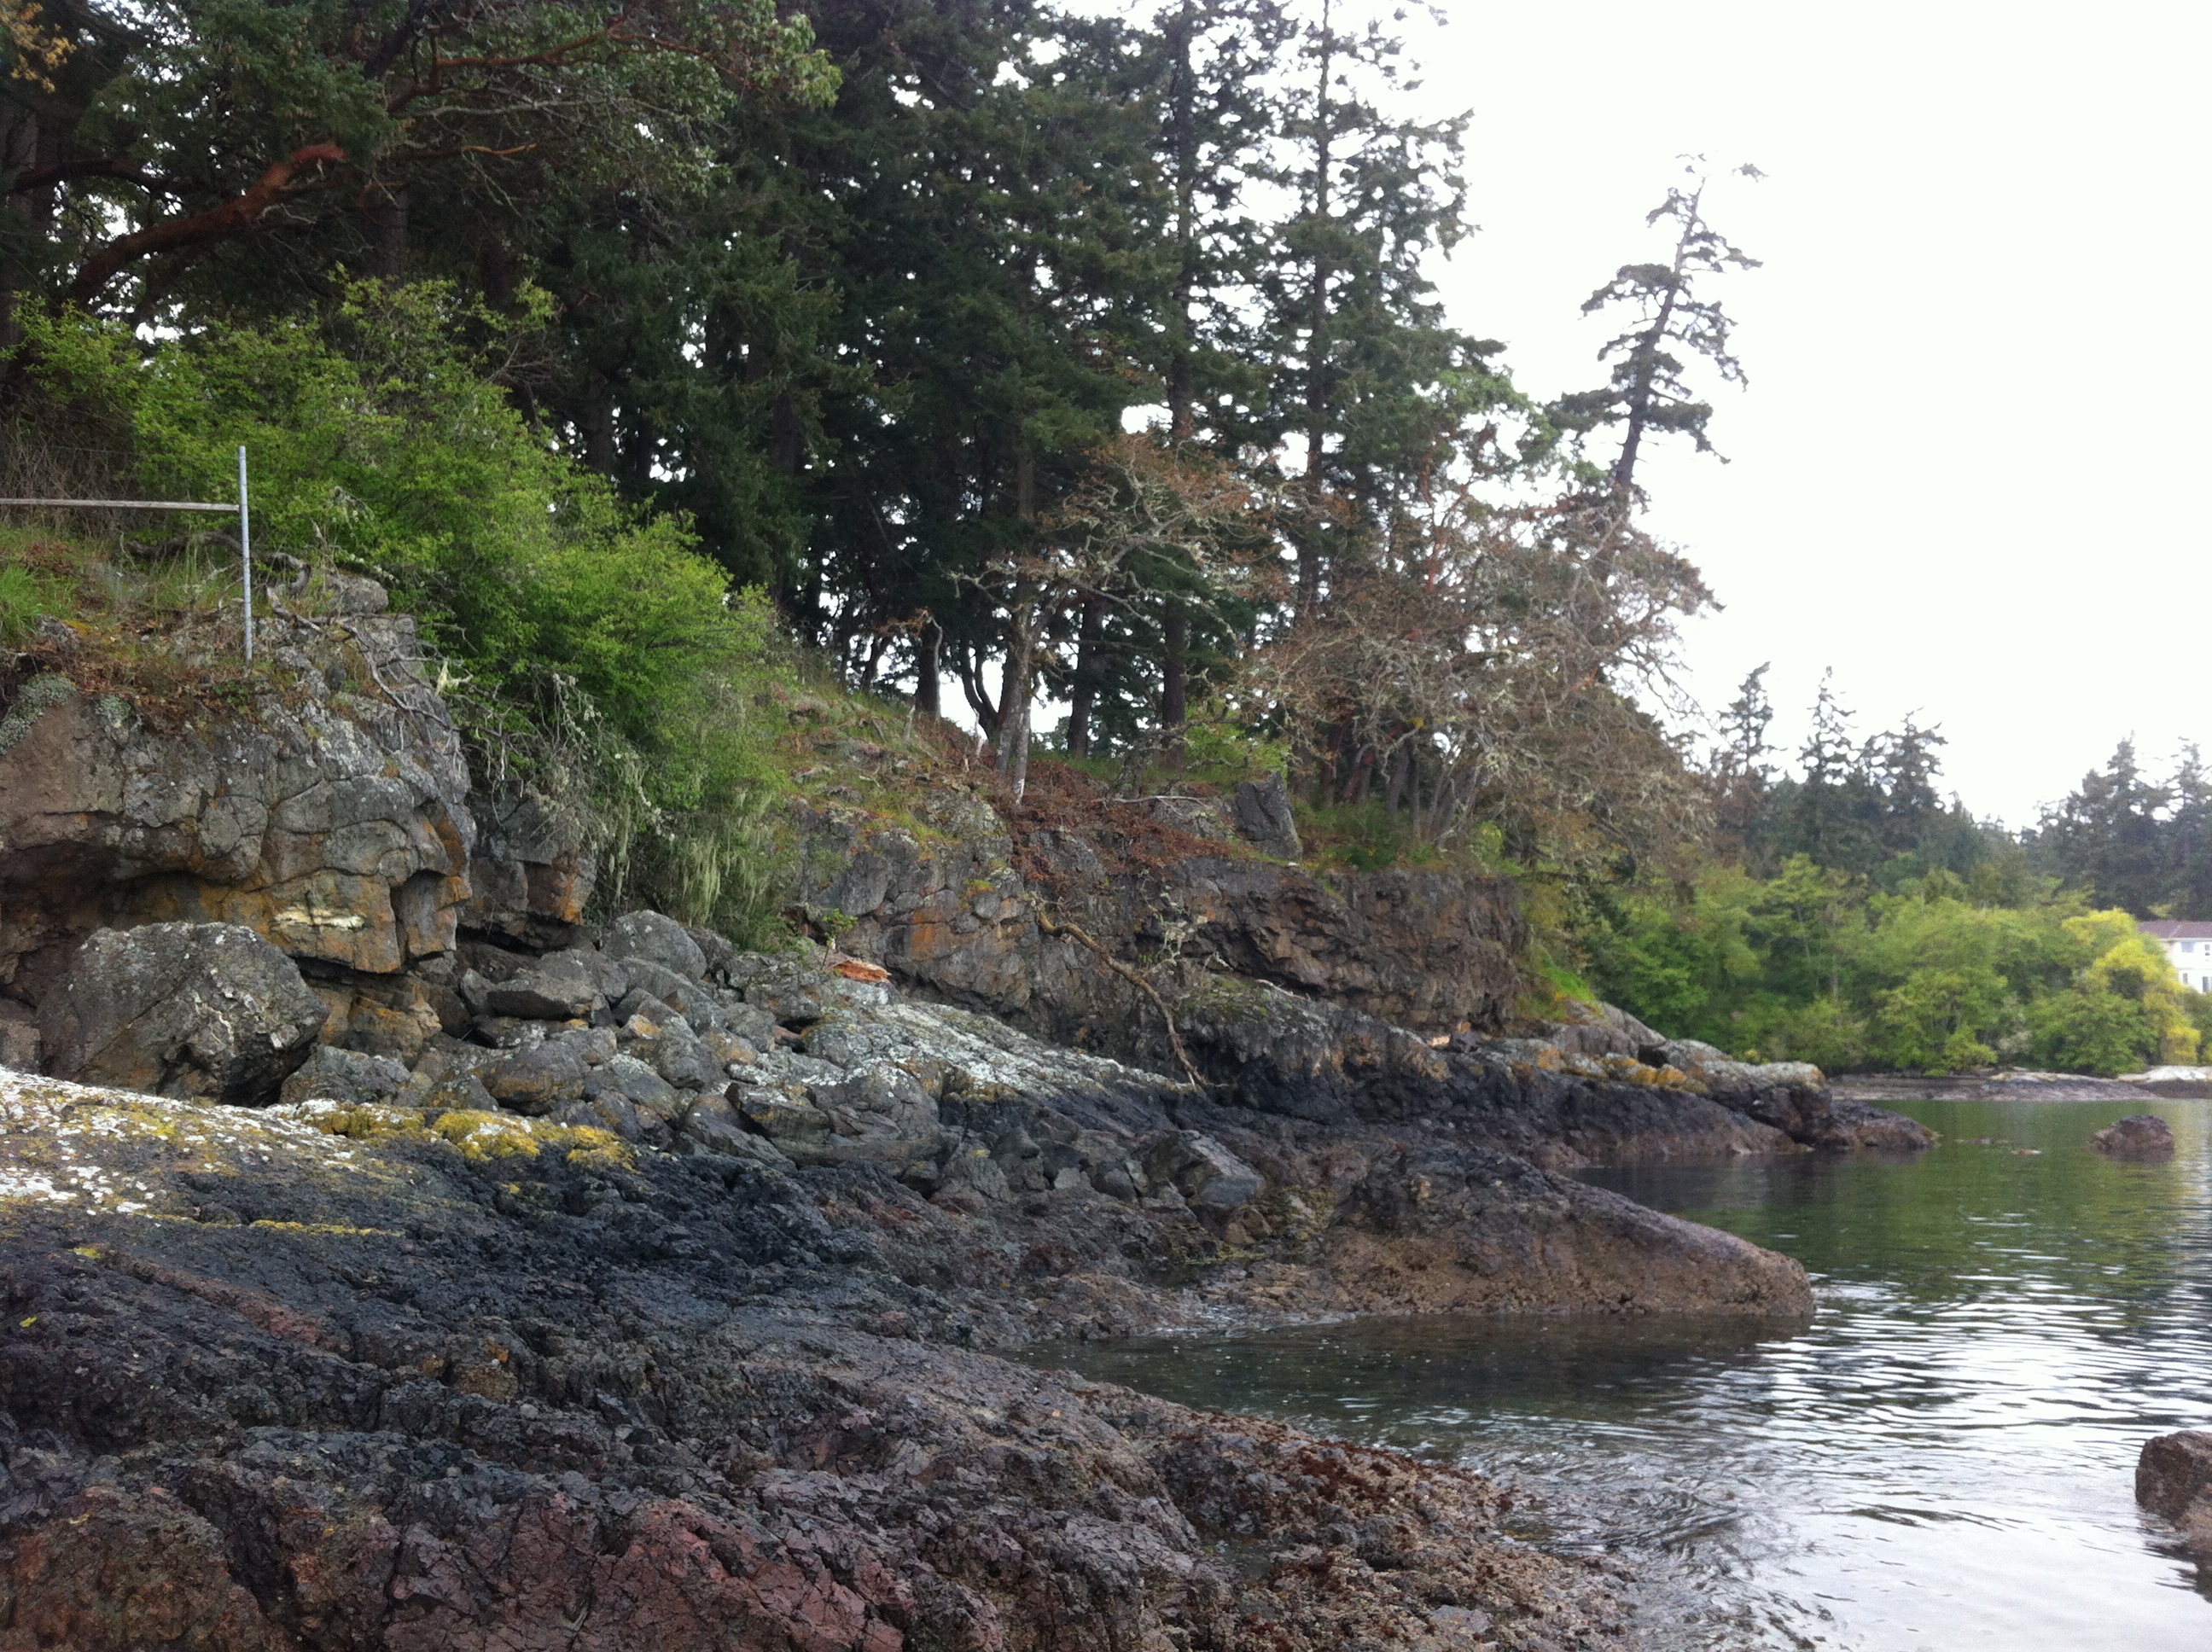
The shorefront on the property north of Tower Point which is subject to a subdivision proposal
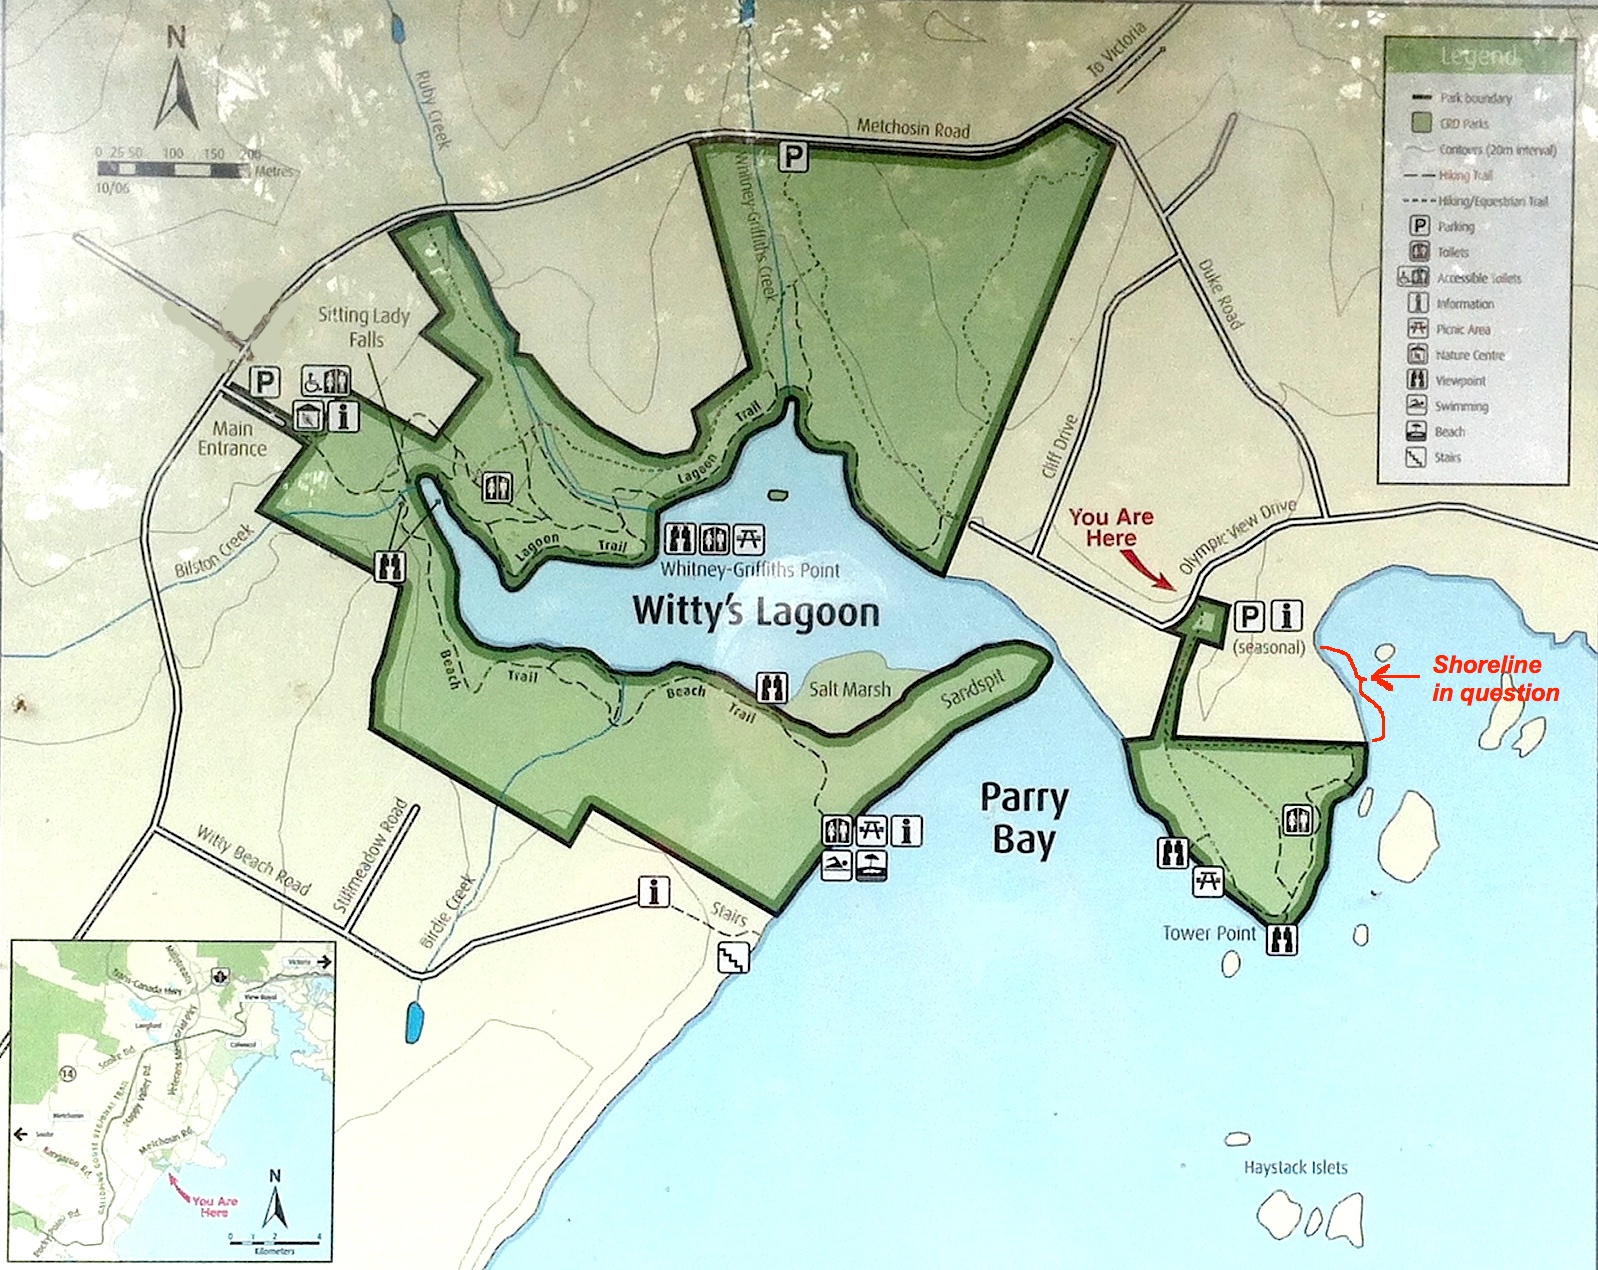
The shoreline location— see red arrow and bracket on the right.
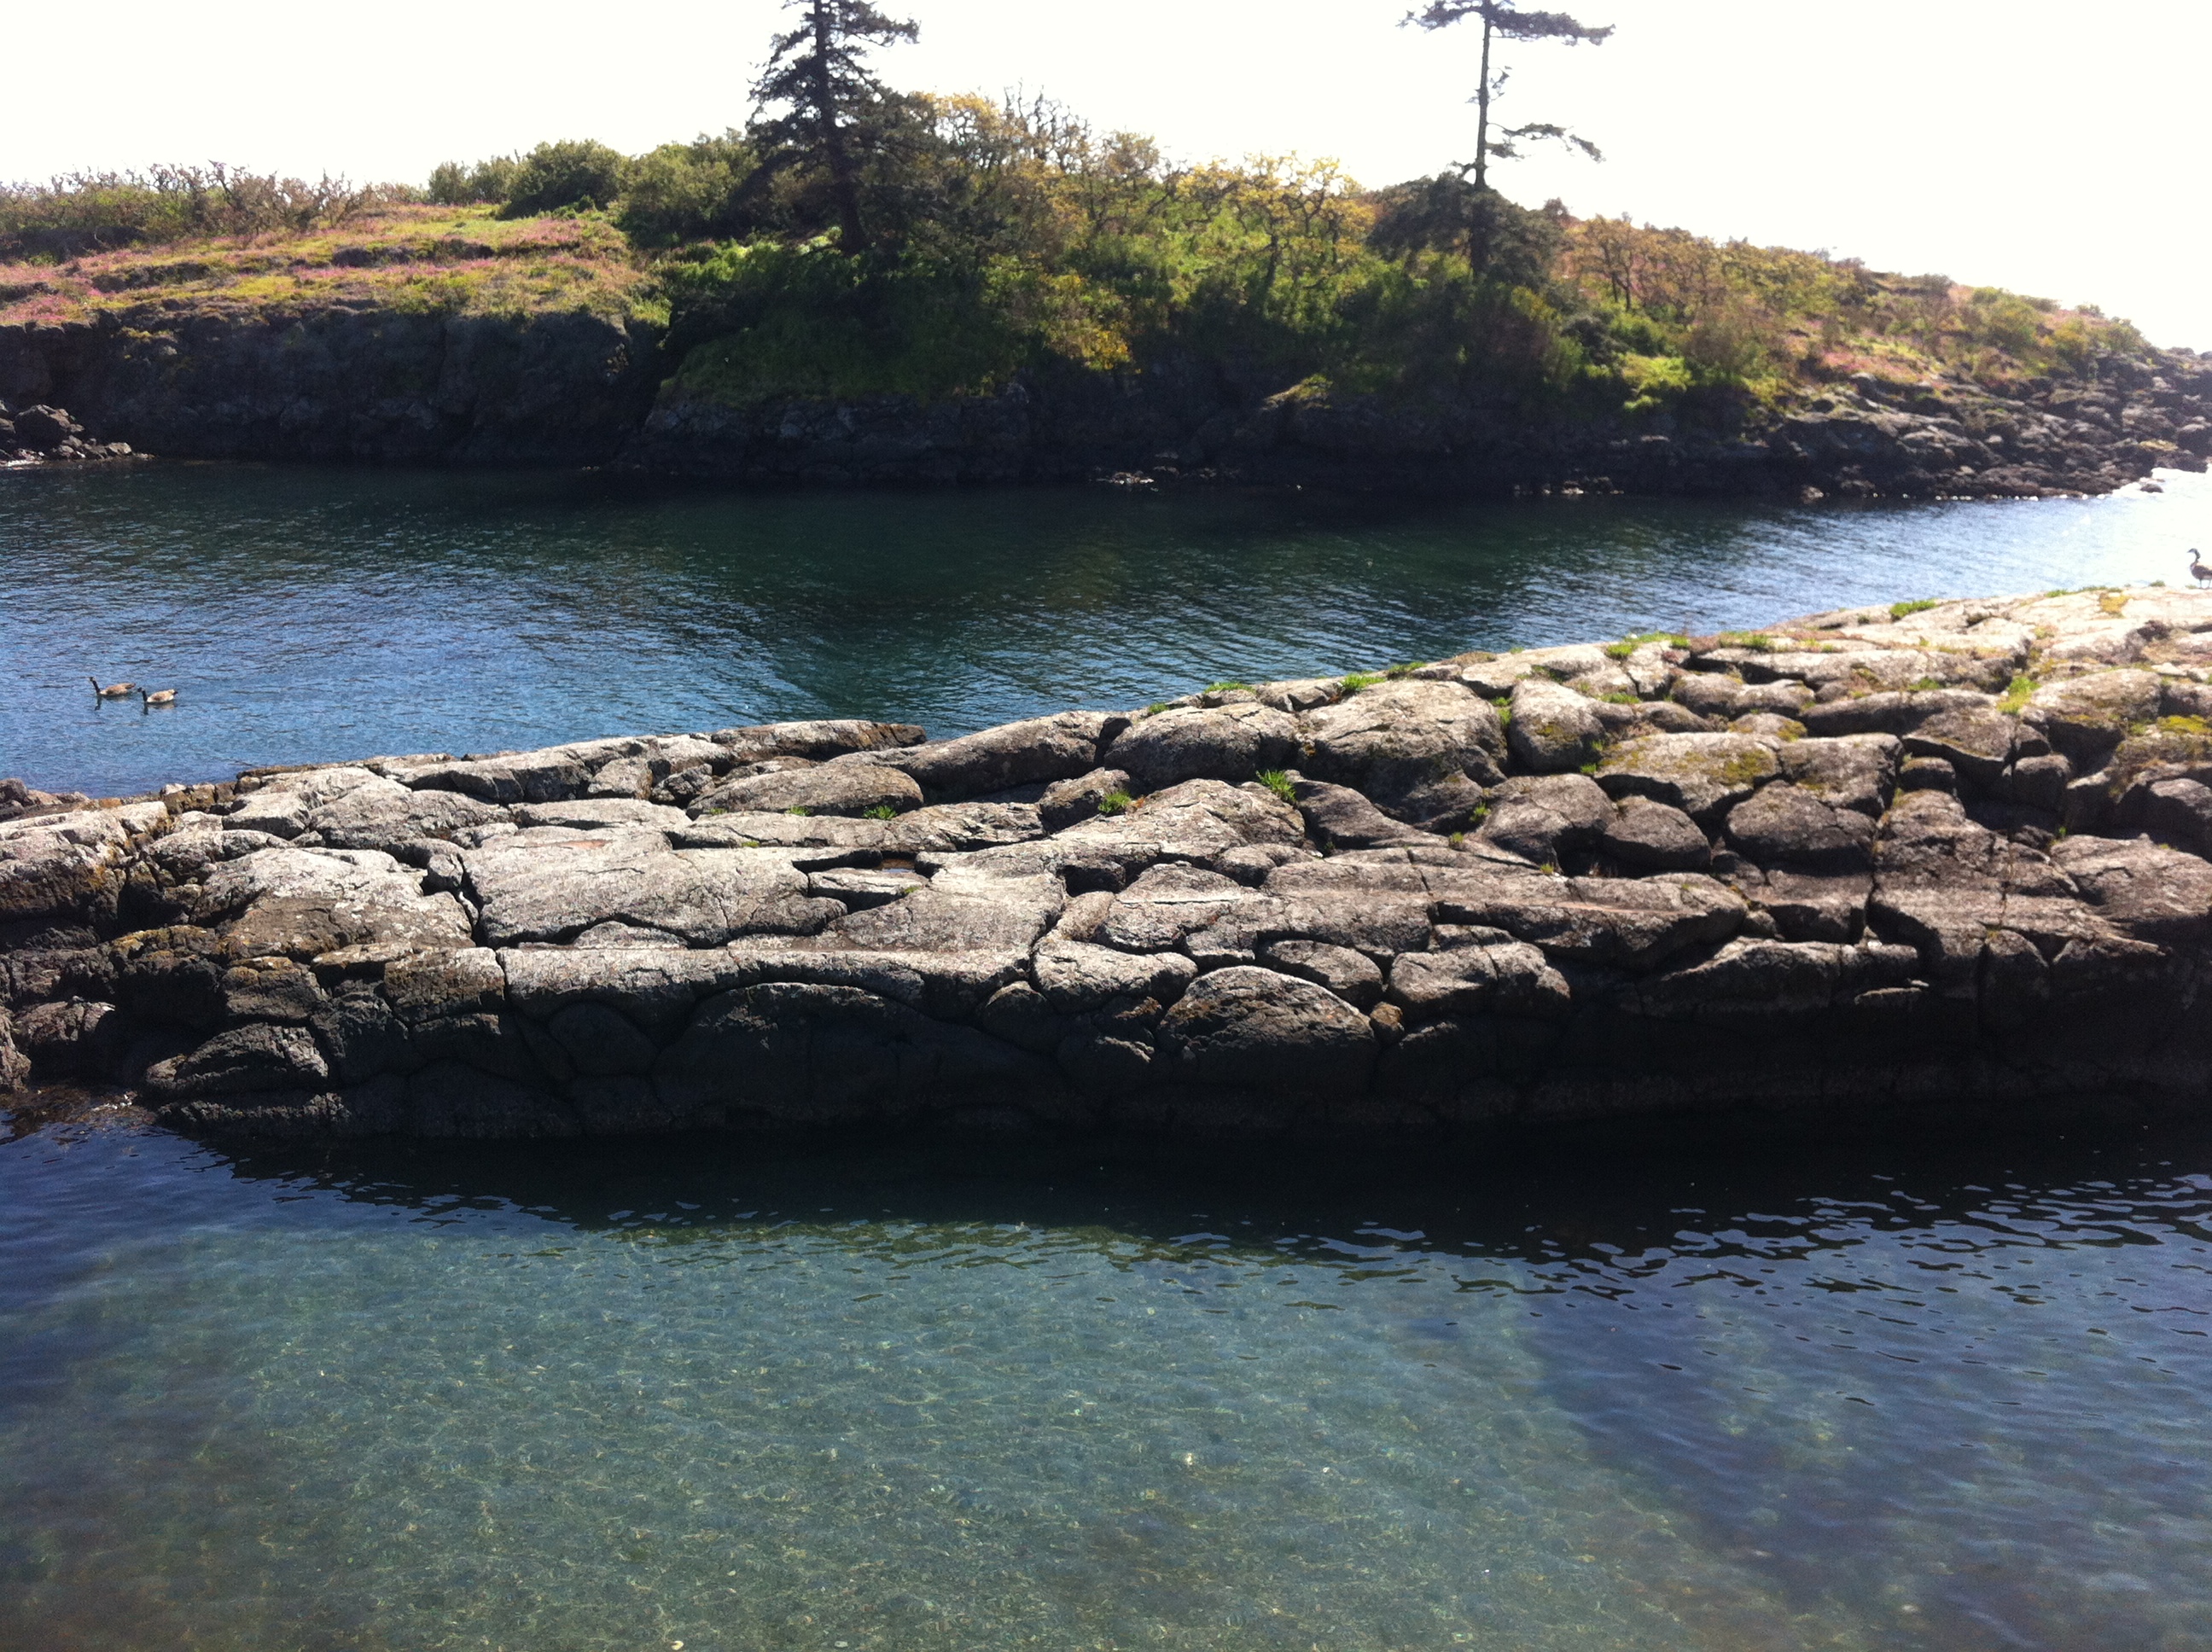
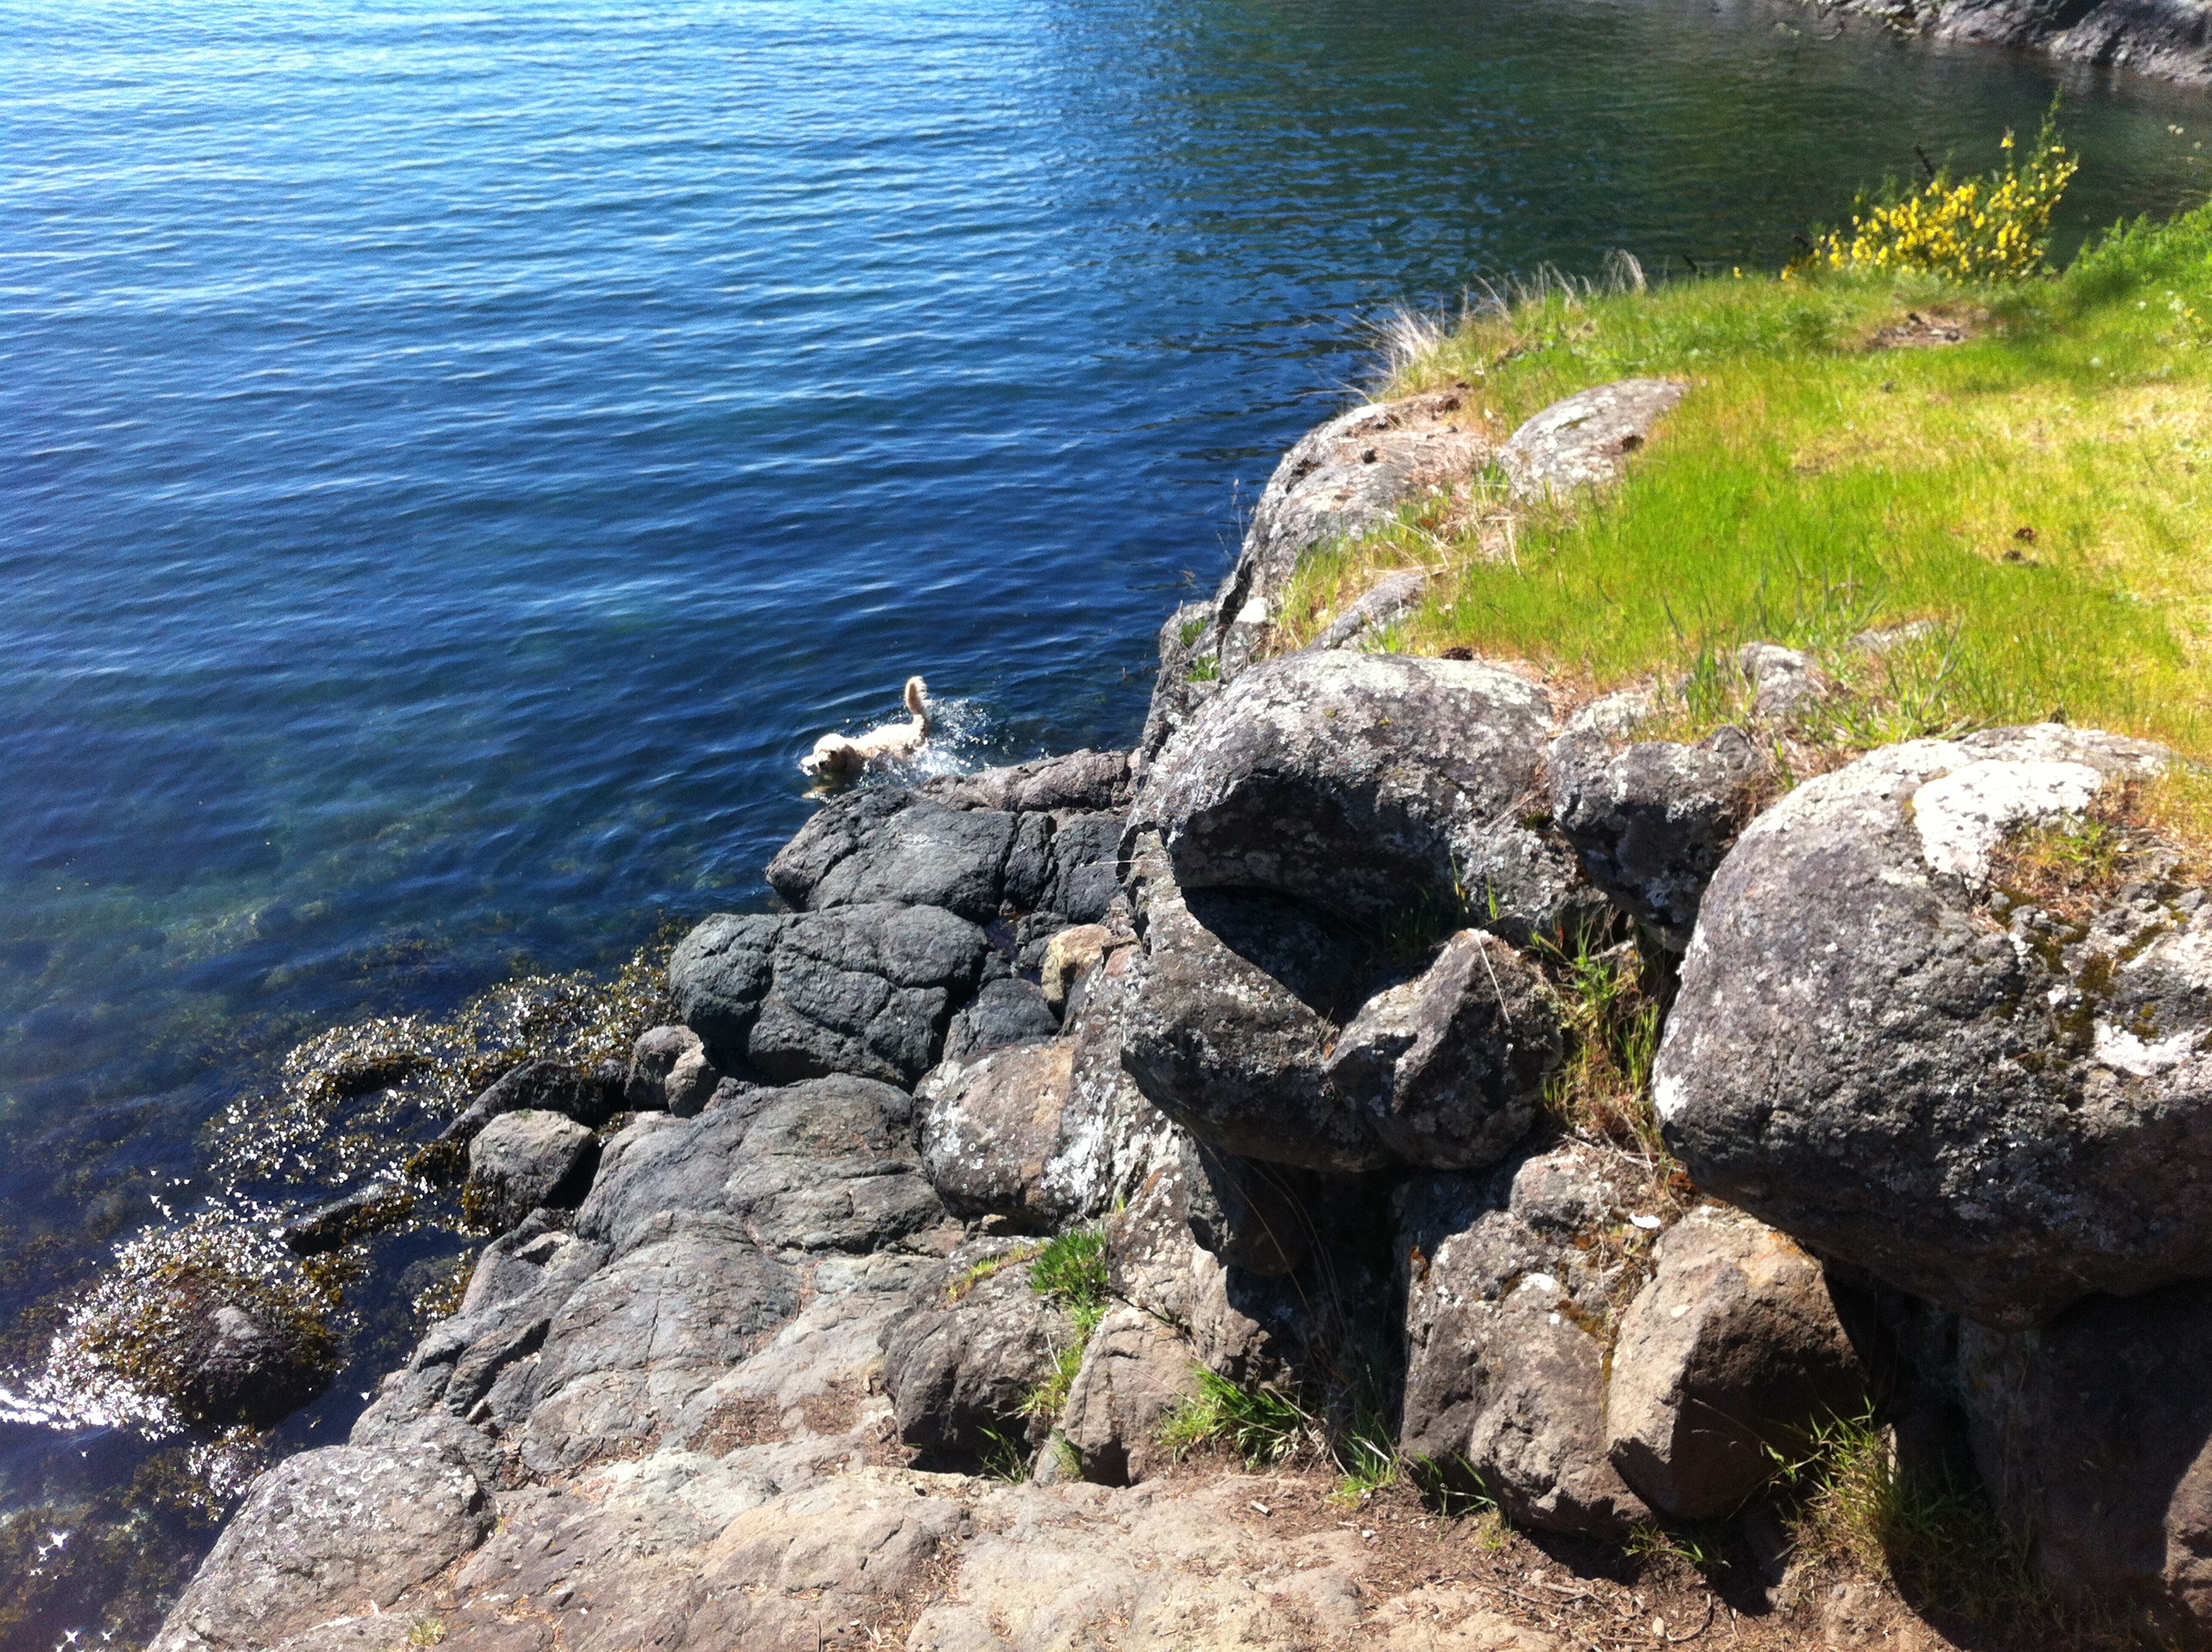
I also took some pictures of the wildflowers and features of the shoreline in the park at Tower Point bordering this subdivision. See in the next blog.
This file represents one in a series of field labs which have been used by faculty members at Lester B. Pearson College.
The Witty’s Lagoon Estuary and Beach Field Lab
This lab is appropriate for an introductory level class in ecology. It may also serve as a reference for those planning field labs for other similar coastal ecosystems.
We will spend one week on this field lab. The actual field excursion is only a part of the whole package. We will go to the Witty’s Lagoon Beach and Estuary, where we will further develop the concepts of structure and function of ecosystems, interactions between ecosystems, geological evidence, adaptations to abiotic factors .
Background references:
Odum, Ecology, page 224-228
Sumich, Biology of Marine Life: p 119-124
Carefoot, Pacific Seashores–section on Dune Vegetation.
Section on Witty’s beach from the OIL SPILL TRILOGY:
CRD Coastal Management Booklet page 6 and 8.
Ecological Systems Interact: This is a feature of systems we have seen in some examples but it is particularly well represented here as there are many features of this area that provide valuable examples of systems operation and interactions.
HUMAN IMPACT:
Record all examples of how humans interact with the ecosystems here. Include these on your map. In class, get further evidence from the Oil Spill Trilogy video .
ON THE BEACH:
1. Note the bulkheading near the stairs. Diagram the effect of this type of structure on the stability of the beach.
2. Locate on the map the feeder bluff, make a diagram of the area to include this feature, indicate it’s relationship with the beach. Indicate the implication of human modification to this process.
3. From the maps available , the pictures in the CRD booklet and your observations, diagram the spit , showing the history of it’s development.
4. Show the direction of ocean energy impact and long shore drift. What would happen if a solid bedded roadway was built along the spit, especially close to the berm ?
5. Draw a cross sectional profile of the beach showing the foreshore, the berm, the backshore and the lagoon and the associated vegetation.
6. The strand line: Describe this feature and comment on the input of energy and materials to this part of the system .
7. The beach VEGETATION: Note and diagram the special adaptations of beach vegetation: What patterns of distribution do you note? and why?
8. How does diversity, and biomass change as you go from sea to land?
9. The grass here is the Dune Grass Elymus mollis.. It is one of the earliest colonizers of the beach area. Diagram the underground root system and comment on it’s role in contributing to beach stability.
10. Carefoot presents a model for the change in pH of the soil from sea to land. Take samples here for analysis back in the lab. Provide any evidence that you can on what effect this may have on the vegetation of the areas.
11. What types of impact do humans have on the vegetated part of the beach and what is the problem with this?
THE SALT MARSH and ESTUARY:
12. Vegetation succession in the SALT PANS. Compare the vegetation that you see here with that of the estuary vegetation in Pedder Bay. Note any differences and similarities. Explain why the vegetation is patterned in this way.
13. A Geological mystery?
Work done by previous students has shown there to be an “OLD” and a “NEW” sand beach . We will investigate this further by sampling from the sand on the beach , and samples from the estuary. We can return these to the lab to look at them in a quantitative way (using soil sieves). From your evidence, piece together the geological events of the past.
14. Use the soil probe to determine the vertical profile of the marsh. Diagram this to scale also. Comment on the geological history of the area.
15. Describe the types of human influence you can observe in this ecosystem.
16. What evidence is there of humans “managing “ this system . Would you consider it to be an ecologically sustainable system.
17. While on this trip, gather enough observational evidence and examples to make a four part systems diagram that shows energy flow and material cycles of four interacting ecosystems: estuary, spit, berm, beach,and ocean. Discuss and compare the level of productivity that you would estimate in each of the systems.
| This site has been created to represent the contiguous ecosystems of the Race Rocks Ecological Reserve/Marine Protected Area and for the use of the Green Blue Spaces sub committee of the Metchosin Environmental Advisory Select Committee ( MEASC). |
Copywrite: G.Fletcher Marine Education Consulting, 2008
webmaster: Garry Fletcher, educational director of racerocks.ca |