Wittys Lagoon Waterose et al. report

Witty’s Lagoon, B.C. Waterose et. al.
Judith R. Burke and: S. Ivanko, R. Luco, J. Walker, S. Wilmot

Index:

1. Introduction:
2. Geomorphology:
3. Biophysical:
4. Land Use and Governance:
5. Summary:
6. References:

Section 1. Introduction:
Inventories of terrain and geomorphology, ecology, and socio-economic aspects are required to appropriately guide human activities and developments. Topography, fauna, and flora inventories are also necessary to understand the underlying processes that control geographic and biotic distributions over space and time.

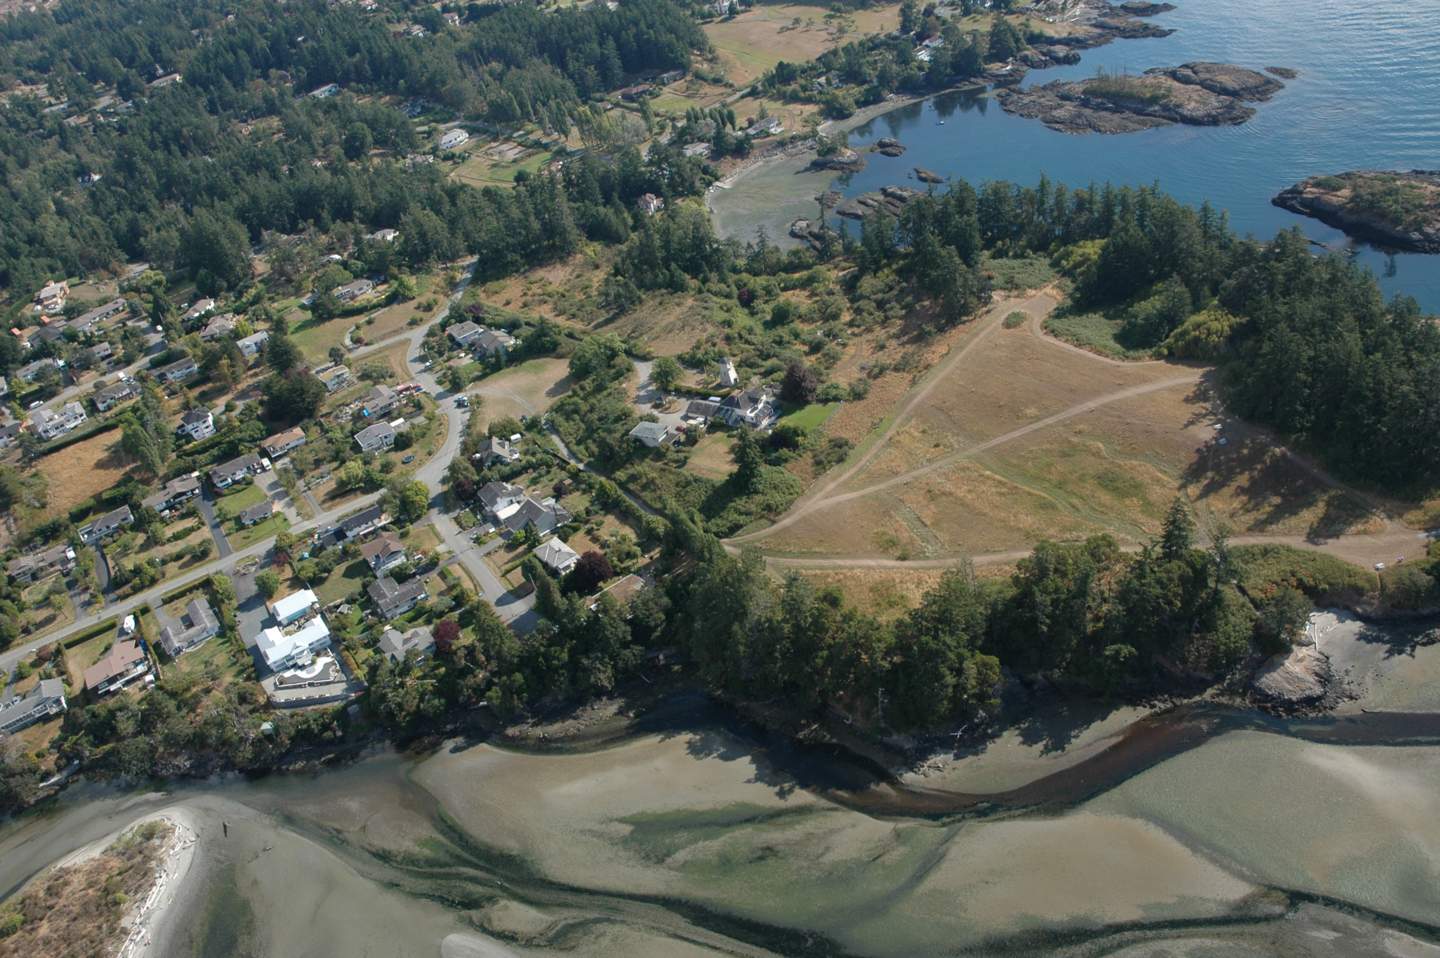
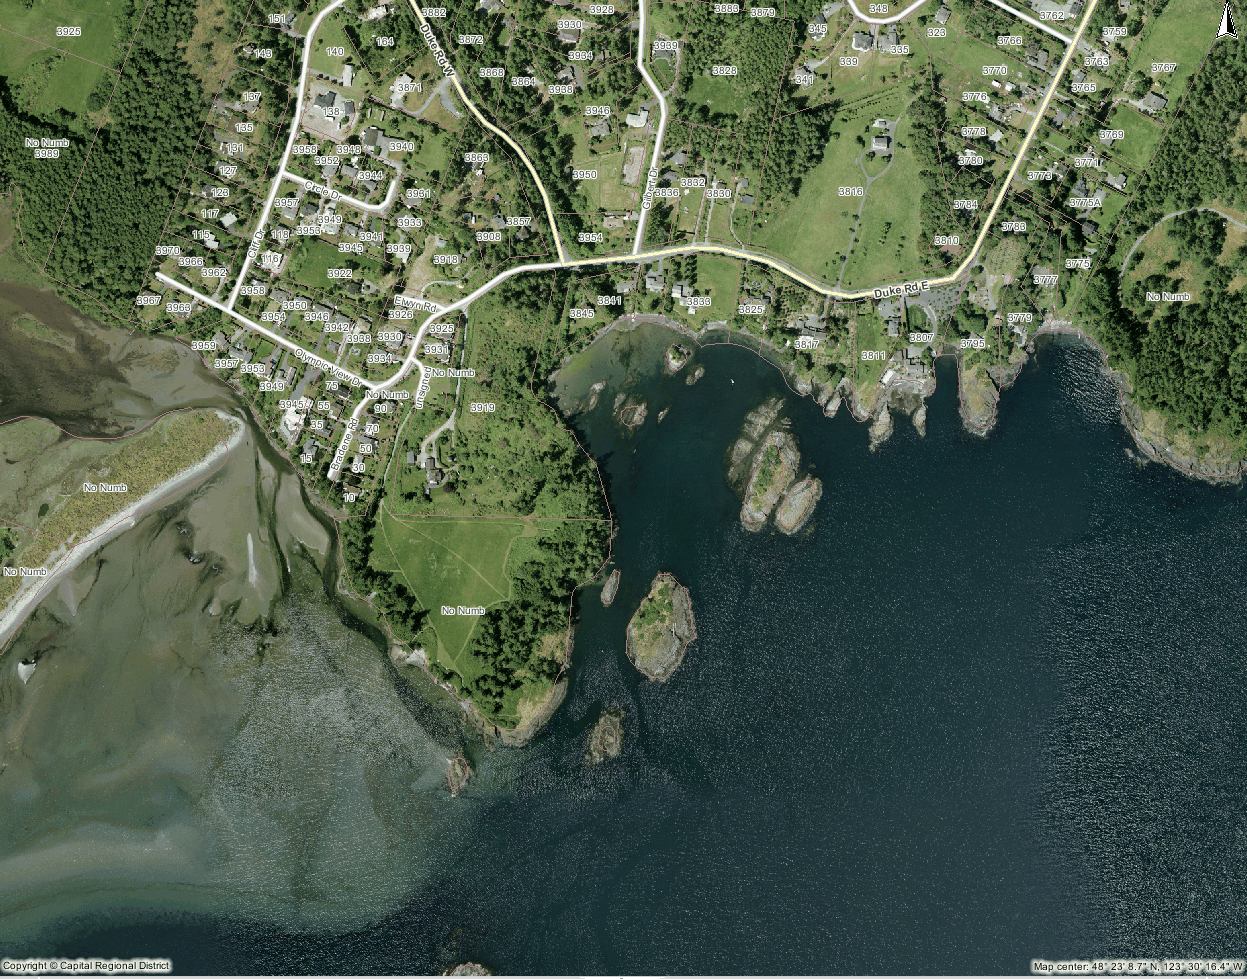
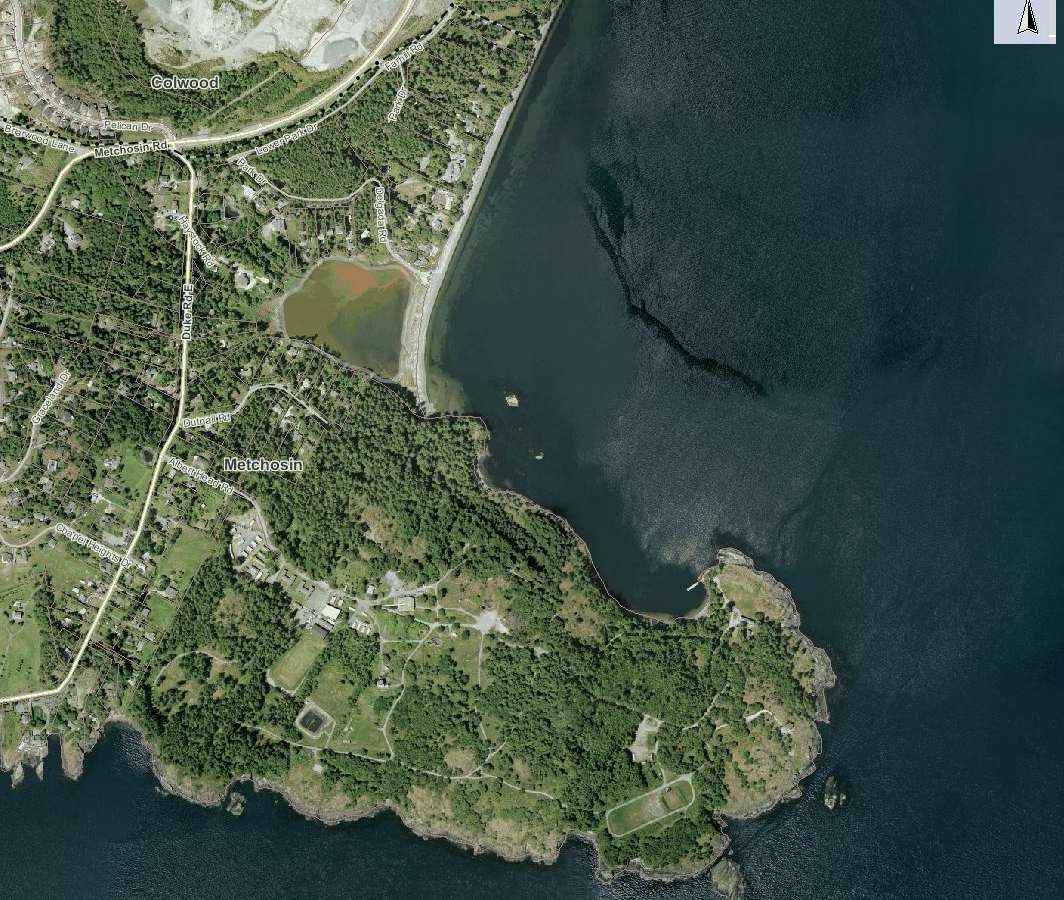
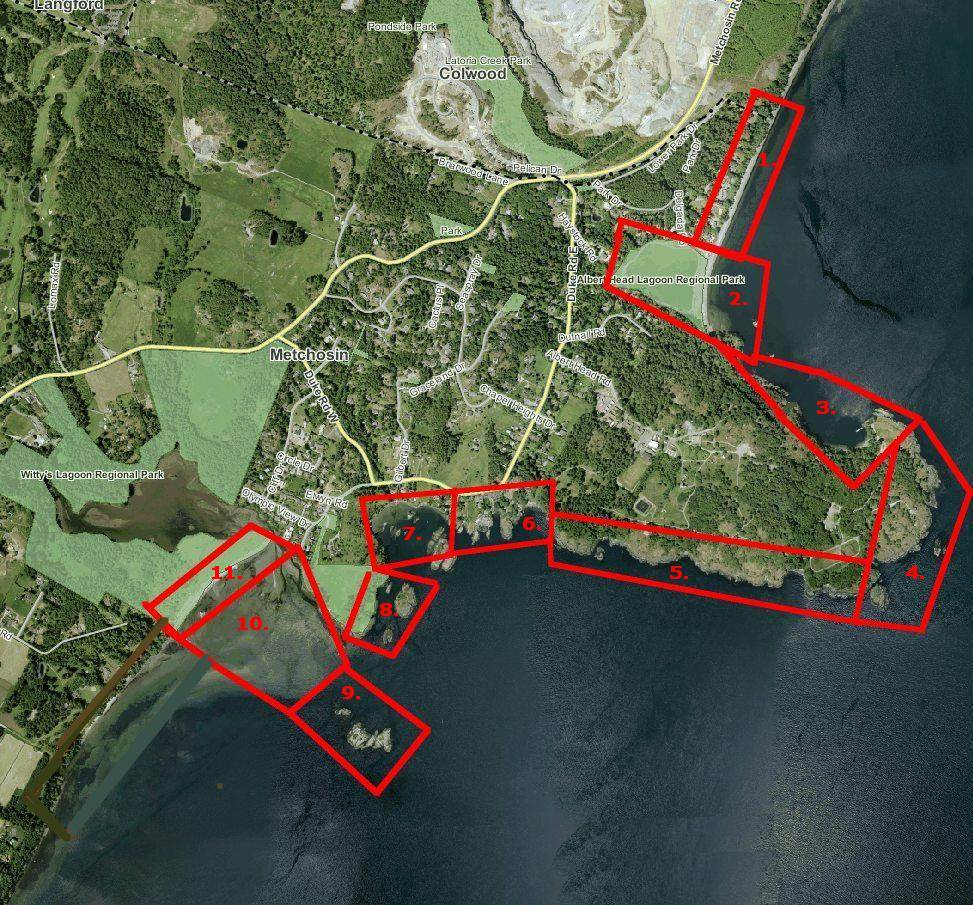
Witty’s Lagoon is located northwest of Victoria, on Vancouver Island, British Columbia.

Map

Land use issues, such as the preservation and enjoyment of the natural ecosystem and integration of anthropogenic uses, are prevalent governance issues for the future of the park and surrounding area. It is important to identify biological and geomorphic features of the area, as well as human impacts and socio-economic factors to develop sound coastal zone management plans.

Report on Witty’s lagoon (includes Ecology, geology etc. Waterose et al.


1.1 Background:
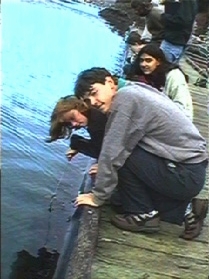
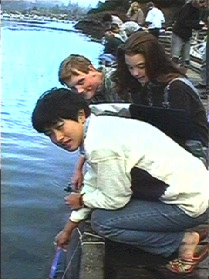
A unique feature of Witty’s Lagoon Park is the wide range of habitats contained within the 51.4 hectares. From Metchosin Creek and the surrounding Douglas-fir forest, down to the lagoon and sea, this park supports plants and animals of many types. Witty’s Lagoon provides a wide range of family recreational actities. The ocean beach provides warm summer swimming, the forest area and lagoon offer year-round hiking, trails for horseback riding and diverse habitat for bird-watching (Weston, 1986).

Witty’s Lagoon was settled by a group of Coast Salish Indians called the Ka-Kyaaken. It is estimated that they arrived after the last glacier melted, about 10,000 years ago. Witty’s Lagoon Park contains traces of the village sites, two forts, and, numerous shell middens; ghosts of the lives gone past (Weston, 1986).

In 1851, after the signing of the Fort Victoria Treaties, Witty’s Lagoon was purchased by Captain James Cooper and was operated as the Bilston Farm by Thomas Blinkhorn. After a series of different owners, the Witty Family purchased the land in 1867 for $6000. Some of the early settlers on the Tower Point side of the Lagoon included the Hunt, Duke and Rosman families. More recently, the Capital Regional District (CRD) has owned and managed the park since 1969 (Weston, 1986).

Section 2. Geomorphology:
2.0 Ecosystem Analysis:
There were various types of ecosystems around Witty’s Lagoon. These can be broken down by their proximity to the type of water bodies which lie adjacent. The three main ecosystems are:

1. fresh water;
2. salt water;
3. and, transitional area.

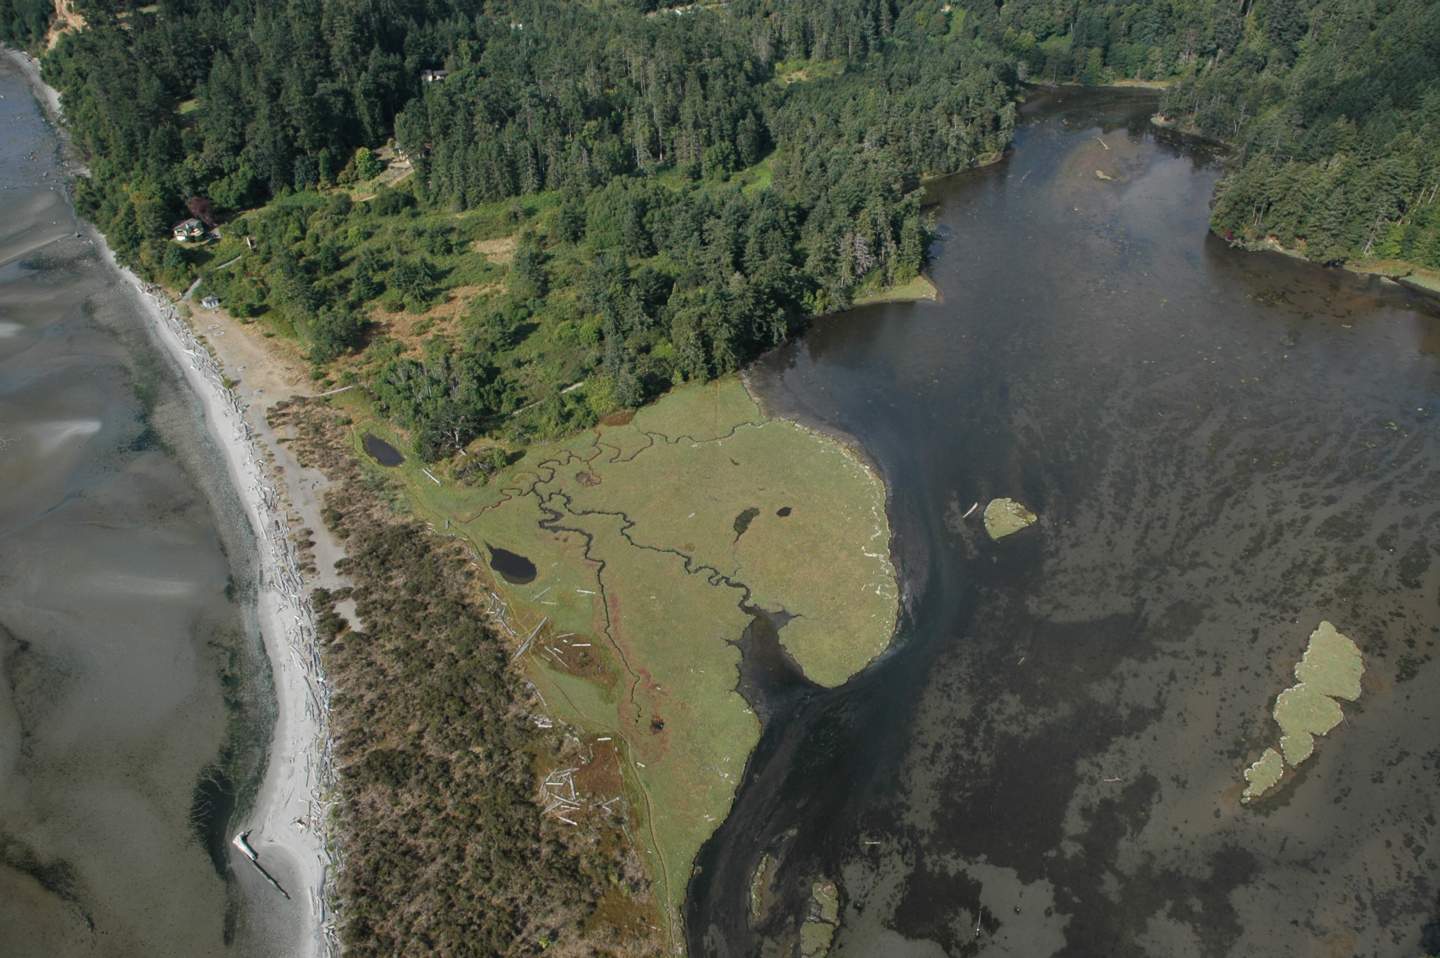
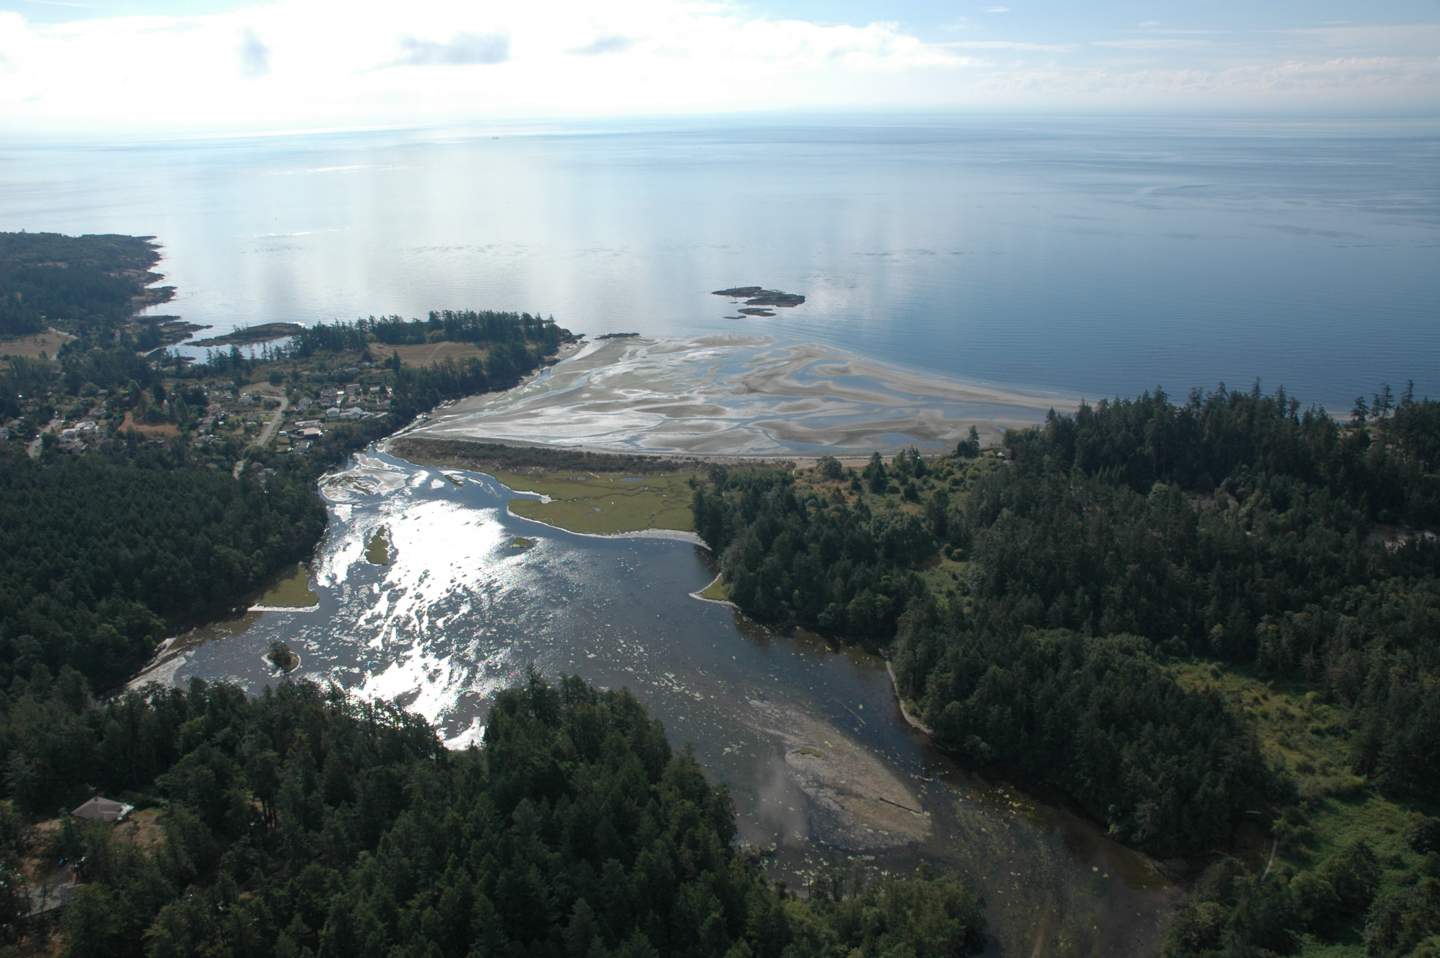
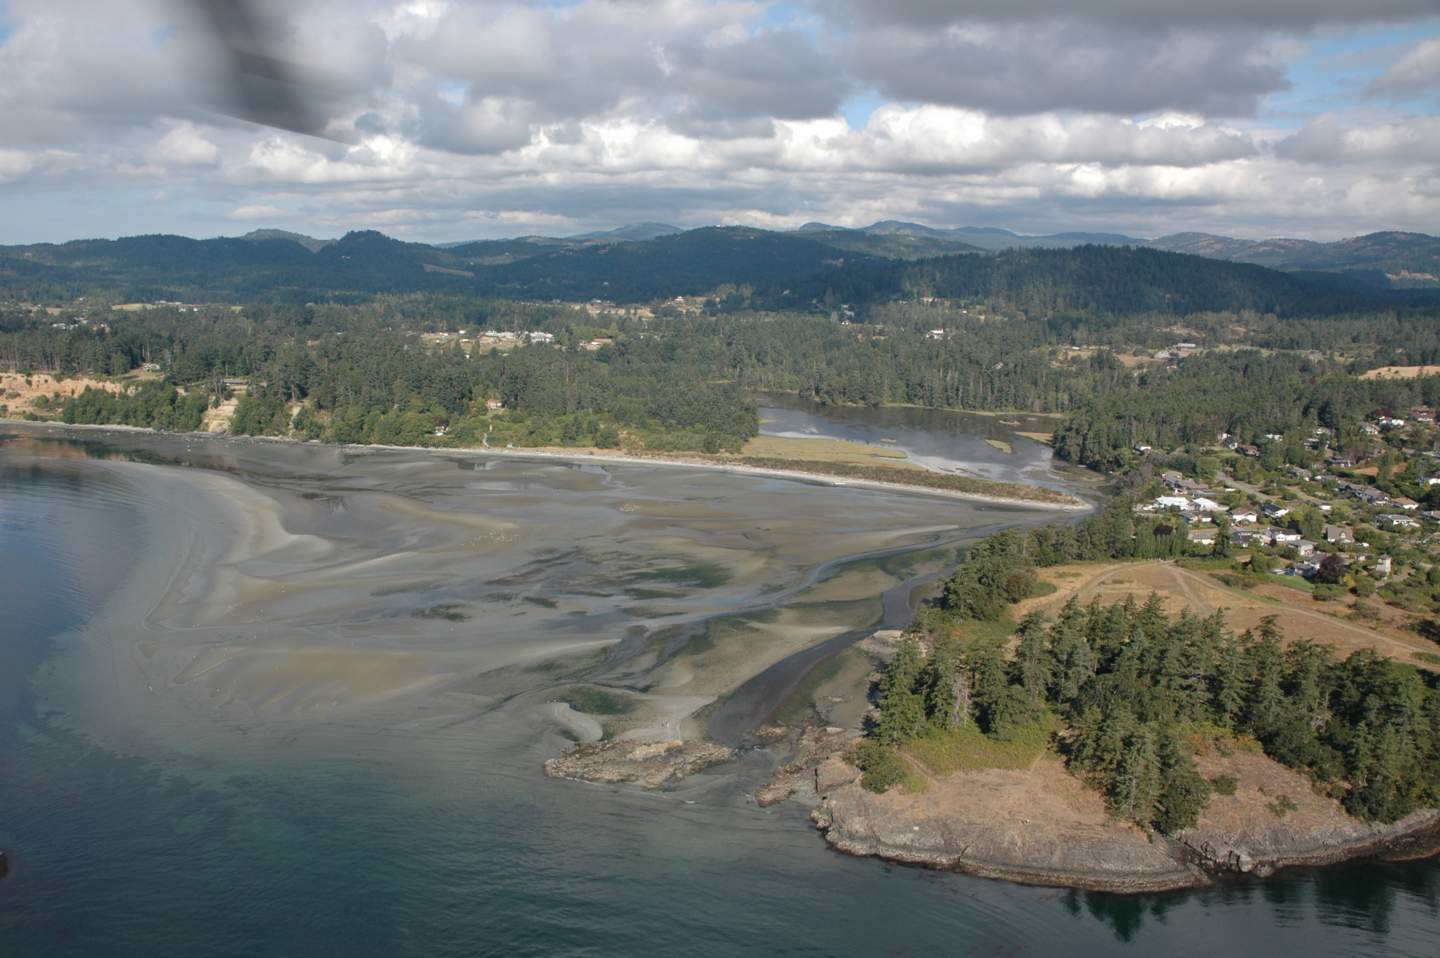
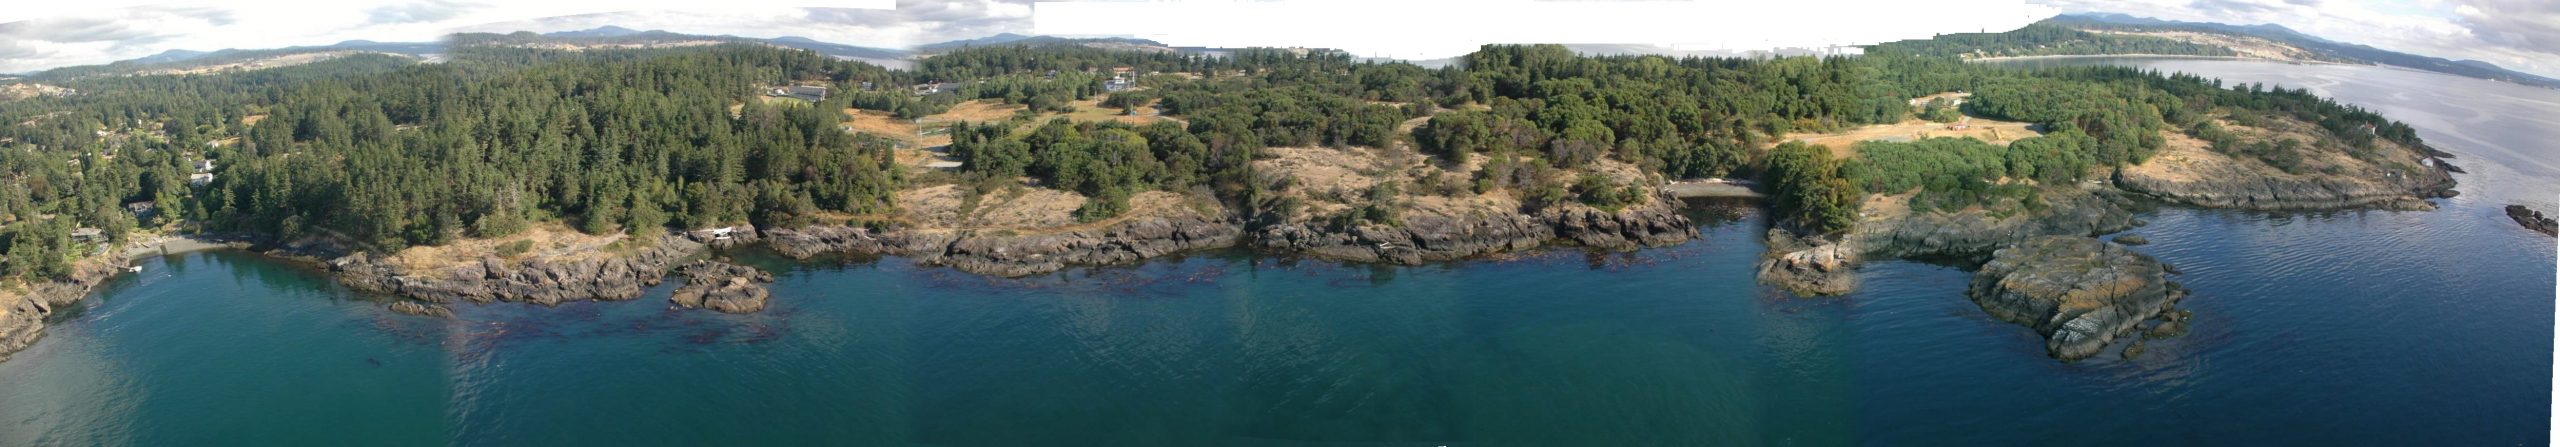
An overview of Witty’s Lagoon is illustrated in Figure 2.1.

Overview
Figure 2.1 Overview of Witty’s Lagoon
2.1 Fresh Water:
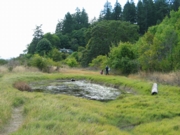
Waterfall The fresh water ecosystem includes the park area where the surface stream, Bilston Creek, flows through the forested trails and thunders over the towering waterfall. This waterfall is the physical boundary that separates the fresh water zone from the salt water zone at the high tide mark.

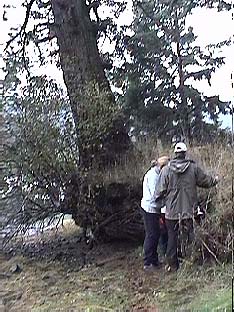
The park trail leads downward from the parking lot to the waterfall, at a rate of approximately one meter vertical for every three meters horizontal. The stream flows rapidly it approaches the waterfall at an estimated rate of 5 meters per second. The stream substrate is a unique feature known as volcanic pillow rock.

2.2 Transition:
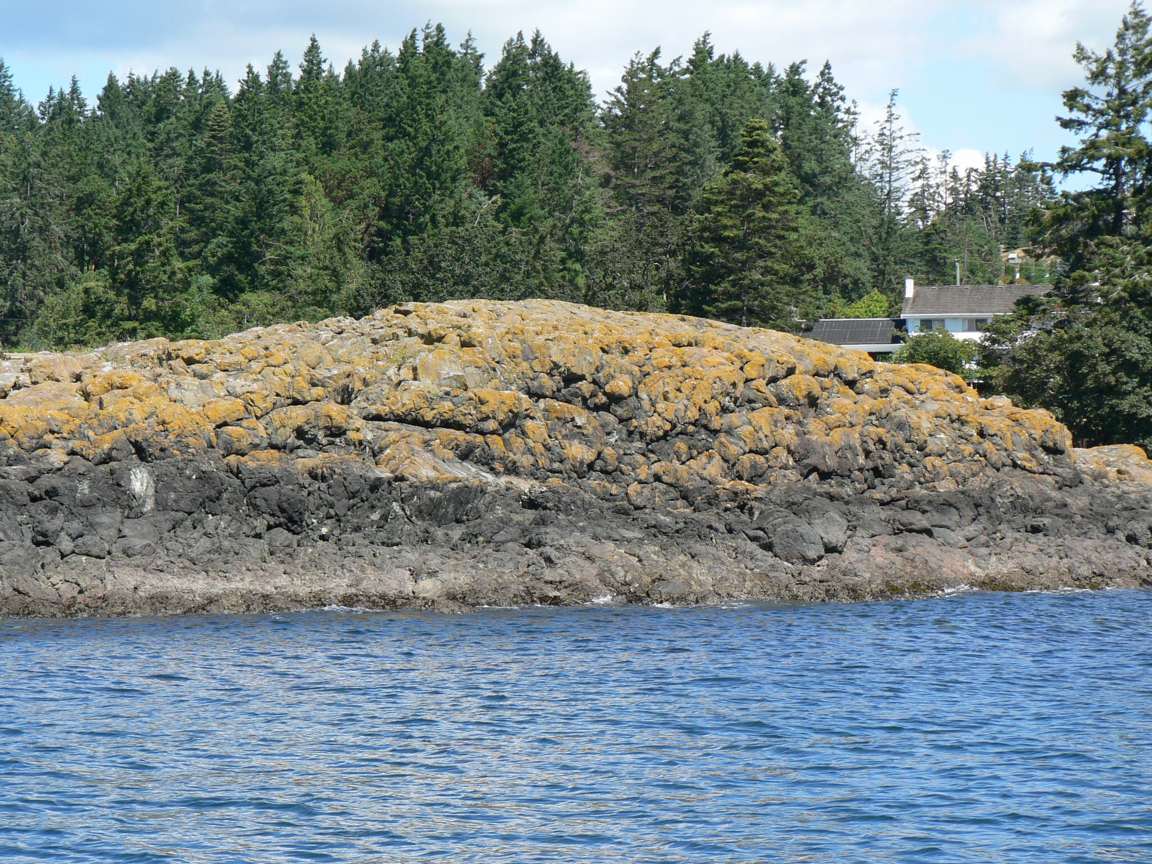
Pillow Blocks The trail slope from the parking lot to the ocean beach is very complex. The trail consists of abrupt slopes by the water fall, and levels out as it descends to the ocean. Overall, the trail length is about 800 meters.

The stream bed consists of a volcanic rock substrate; the most common rock form is the unique pillow shape. This forms when a lava flow enters the water, and the outer layer cools, and fresh lava flows and forces the solidified rock to bulge outward. There is very little evidence of erosion of the pillow blocks.

The potholes in the stream were formed by the entrainment of rocks, such as grandiorites, which were scoured by materials carried in the high energy of the stream. Some of the potholes are 0.5 meteres in diameter.

Halfway between the waterfalls and the ocean, there is a micro-floodplain, with tall grasses and a small stream which is crossed by a small wooden footbridge.

2.3 Salt Water:
Beach This ecosystem is the most diverse. It has five sub-communities between the beach and the transitional that include:

1. Beach
2. Storm beach
3. Driftwood
4. Grassland
5. Spit

Each sub-community has distinguishing characteristics.

The cross section of the beach is illustrated in Figure 2.1.

Beach Cross Section
Figure 2.1 Cross Section of Beach
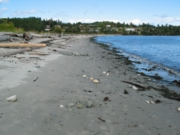
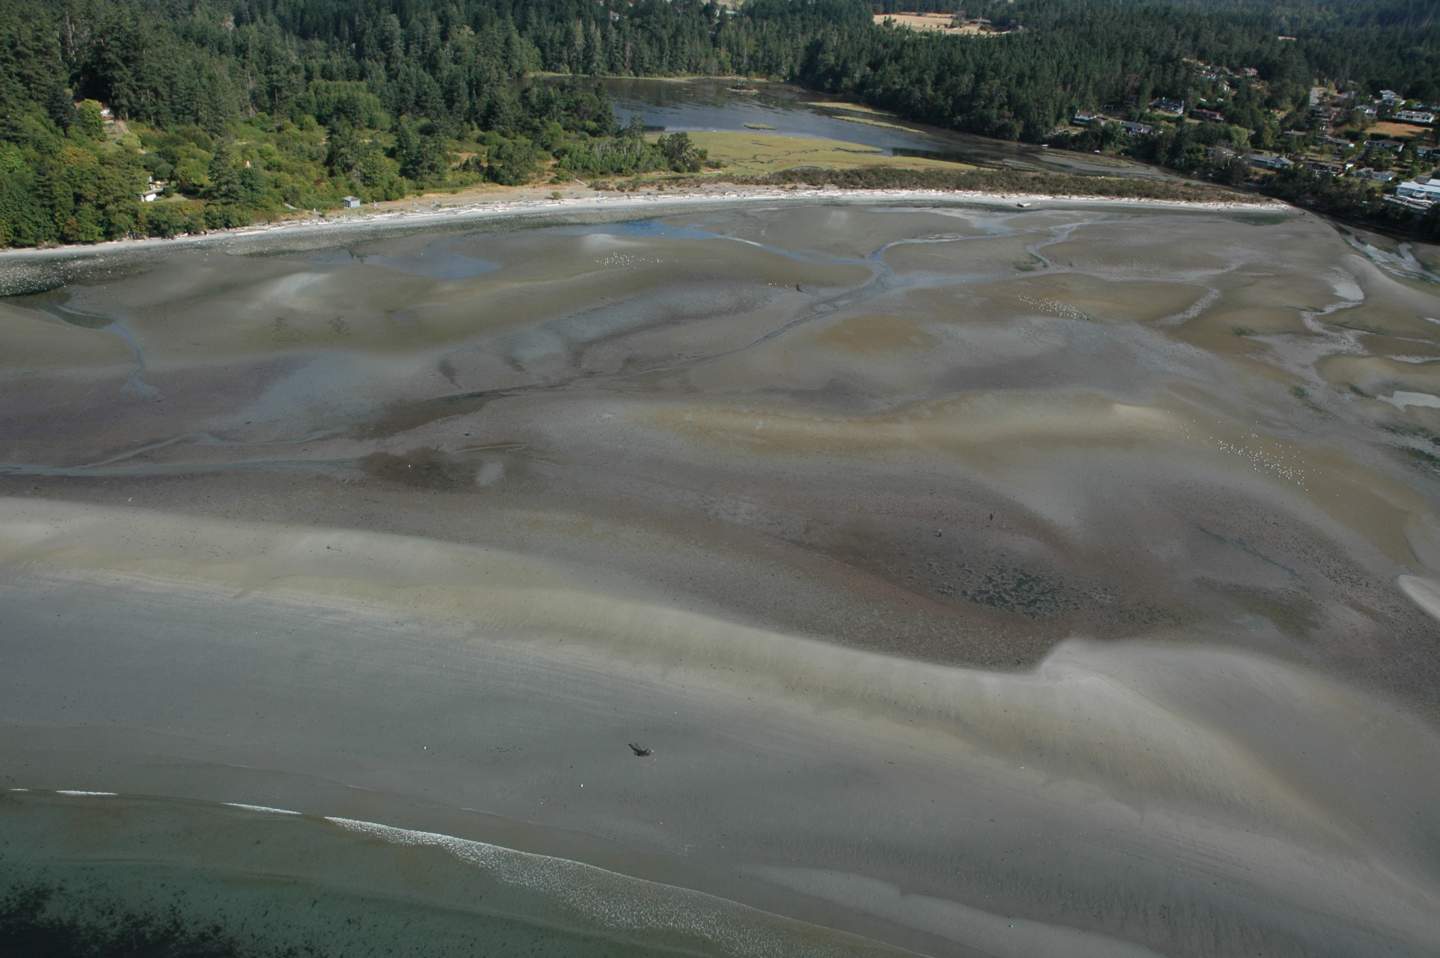
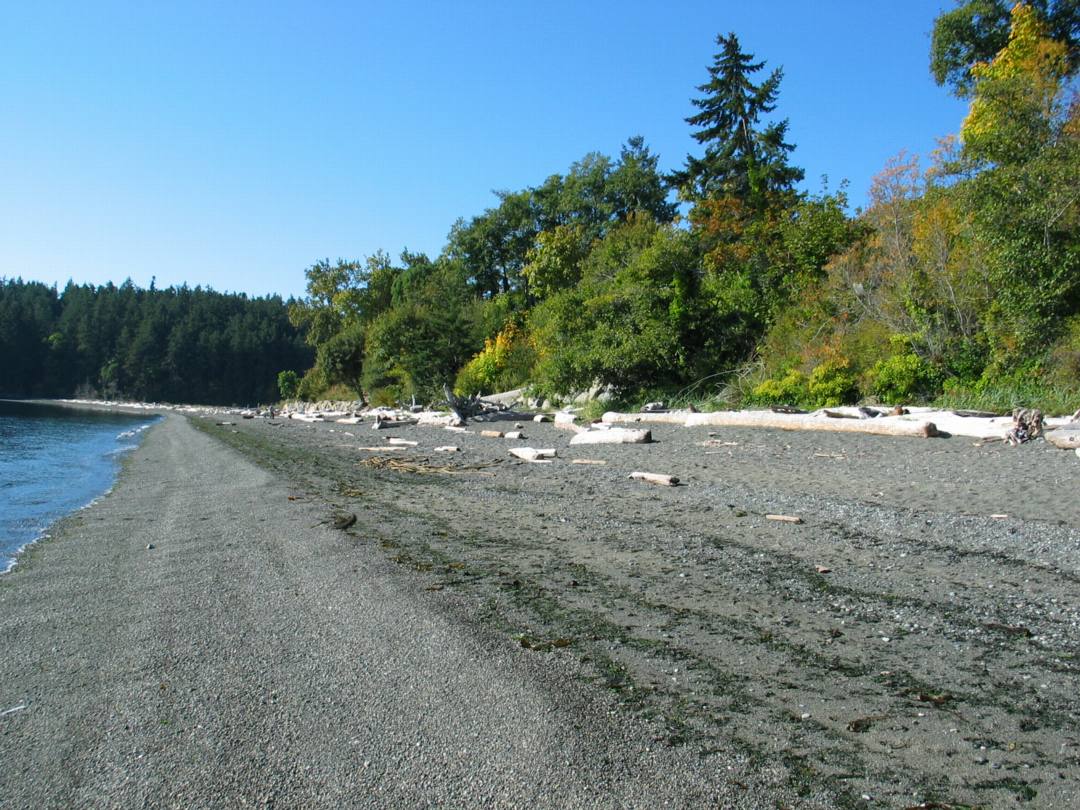
2.3.1 Beach Area:
The beach, below the high tide mark, consisted of a sand substrate that was deposited by longshore drift. It is a beach shaped by moderate energy forces because it faces south and is sheltered from the waves of high energy storms from the west. The sand substrate changed 10 cm below the low tide line, from sand to bands of cobbles. These range from 2.5 cm or less in diameter to unsorted rocks and pebbles greater than 10 cm diameter. The beach slope angled steeply into the ocean at 60%.

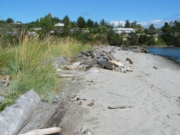
2.3.2 Storm Beach Area:
The storm beach, above the high tide mark, consisted of a loosely packed sand substrate and had a gentle 10% slope gradient. This area was 3 meters wide and the sand exceeded 25 cm depth.

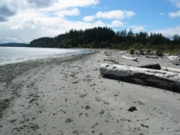
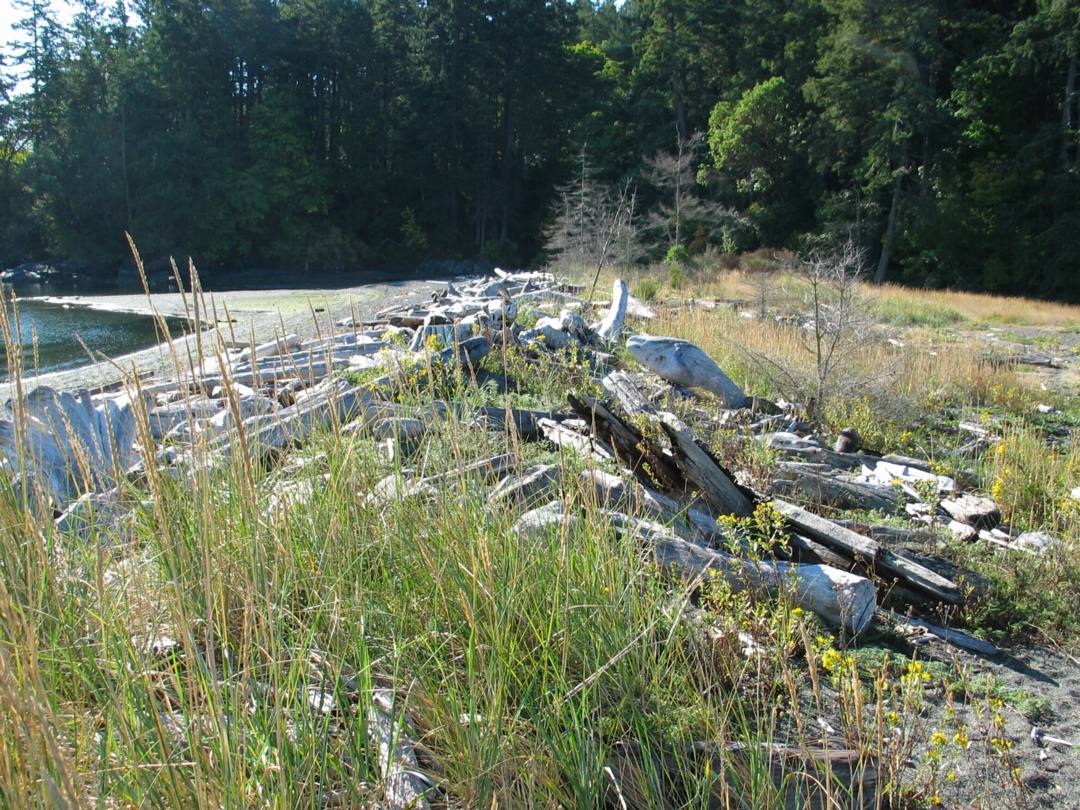
2.3.3 Driftwood Area:
The driftwood area, above the high storm beach area, contained large logs which were deposited by the waves and storm energy. The driftwood formed a natural physical barrier that functioned as a natural retainer wall that anchored the organic soil layer above the beach. There was a sharp rise or step of 1 meter from the beach to the top of the soil layer where the logs were deposited. There were intermittent gaps in the wall of logs, where the sand and soils spilled from the grassland area above and down onto the beach. This transitional area of 1 meter wide included a mixture of logs, soil, sand, rocks, pebbles, and grass.

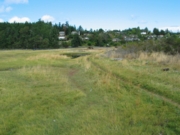
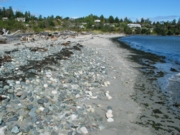
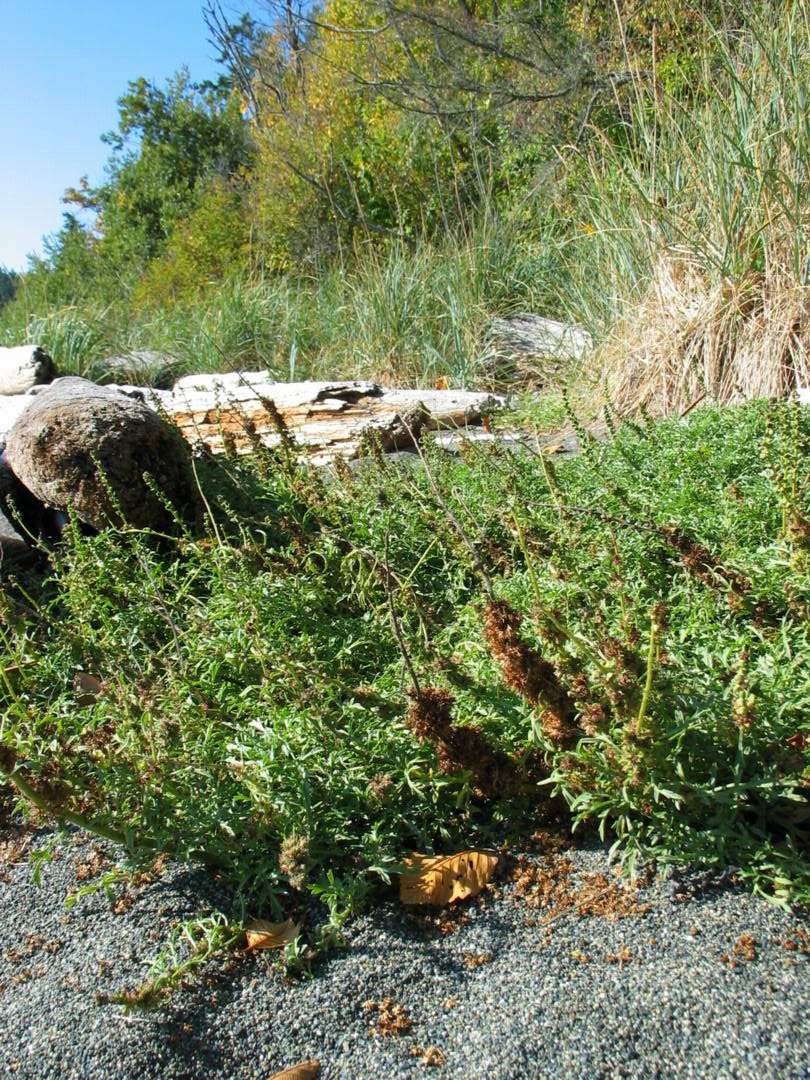
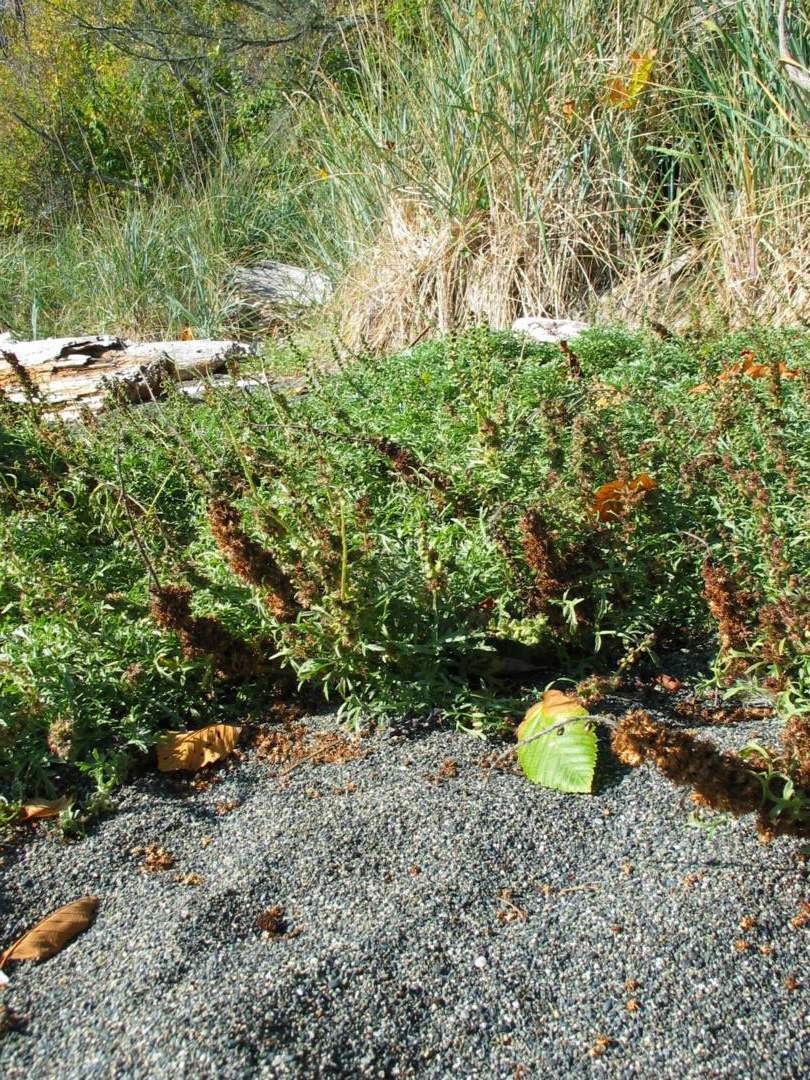
2.3.4 Grassland Area:
The flat grassland area, extended from above the driftwood area to the transitional forested zone. This area was characterised by many species of grasses and thick patches of the exotic scotch broom. This area of accumulated deposition is elevated above the beach zone and removed from the influence of the wave action; and hence, it was colonised by hardy floral salt tolerant species which formed the organic soil layer. The deeper sand would have a high salt content, from its past exposure to the waves and salt spray. The upper substrate was a mixture of unsorted rocks and sand. There were patches of exposed cobbles closer to the shoreline and pockets of sand deposits in the middle of the spit, presumably deposited by winds.
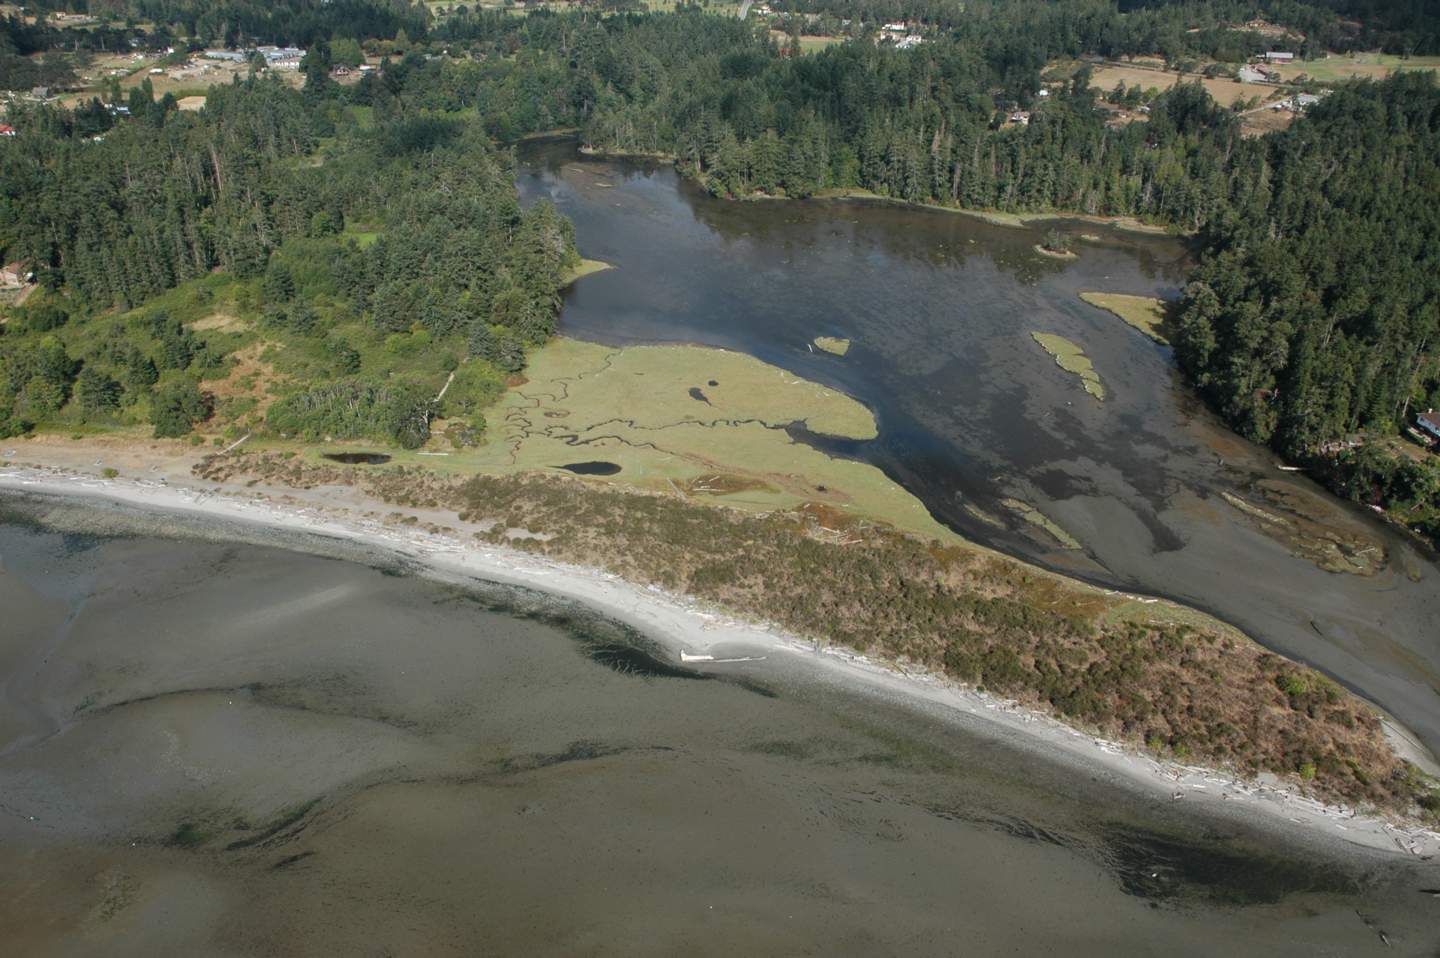
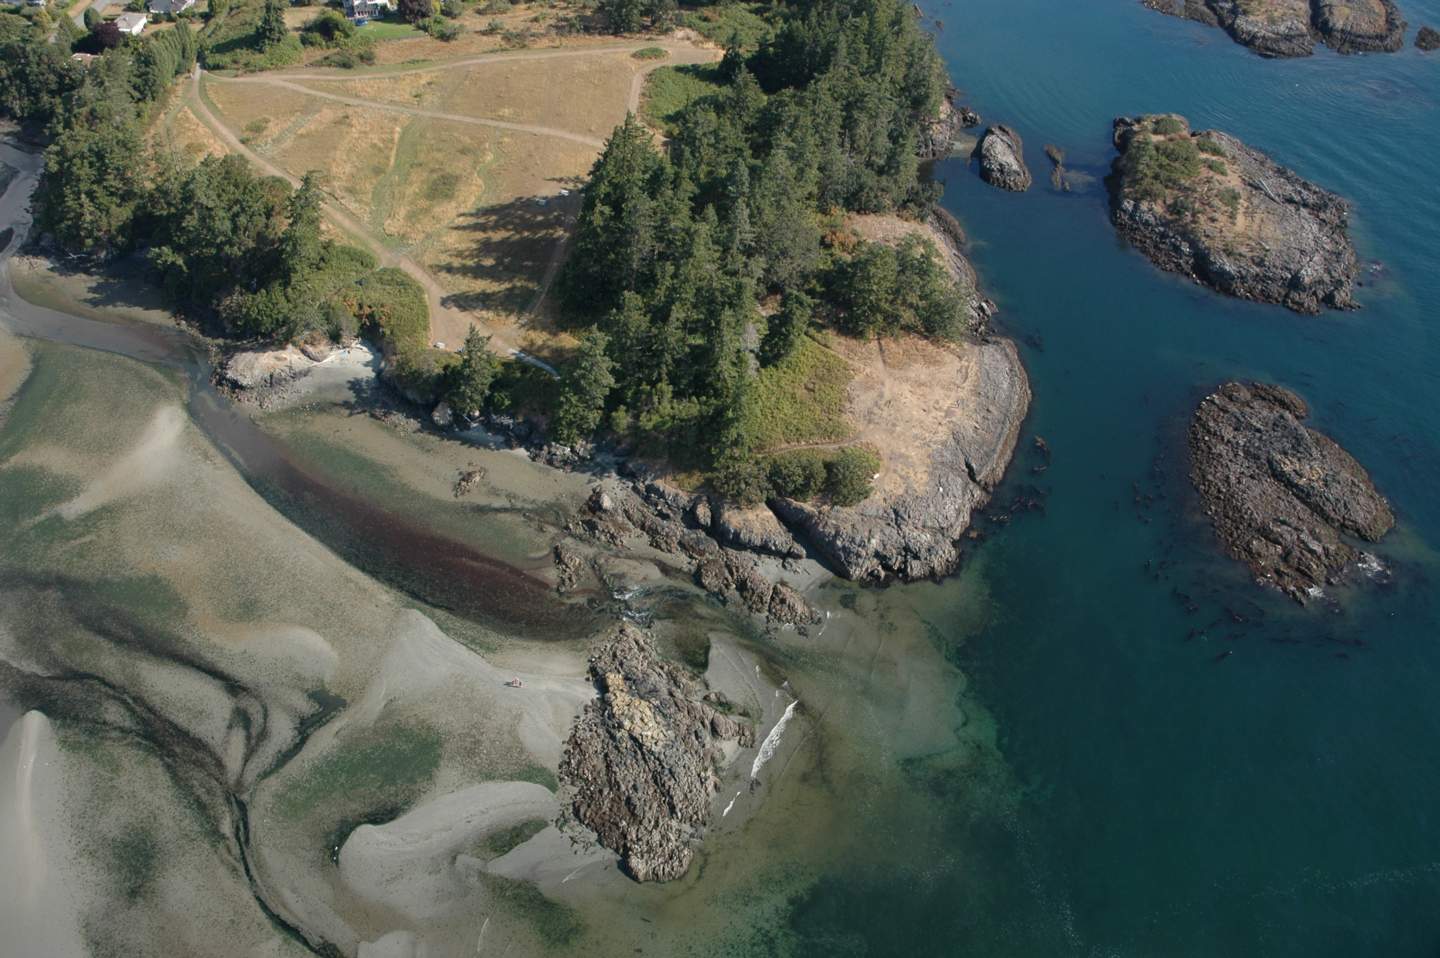
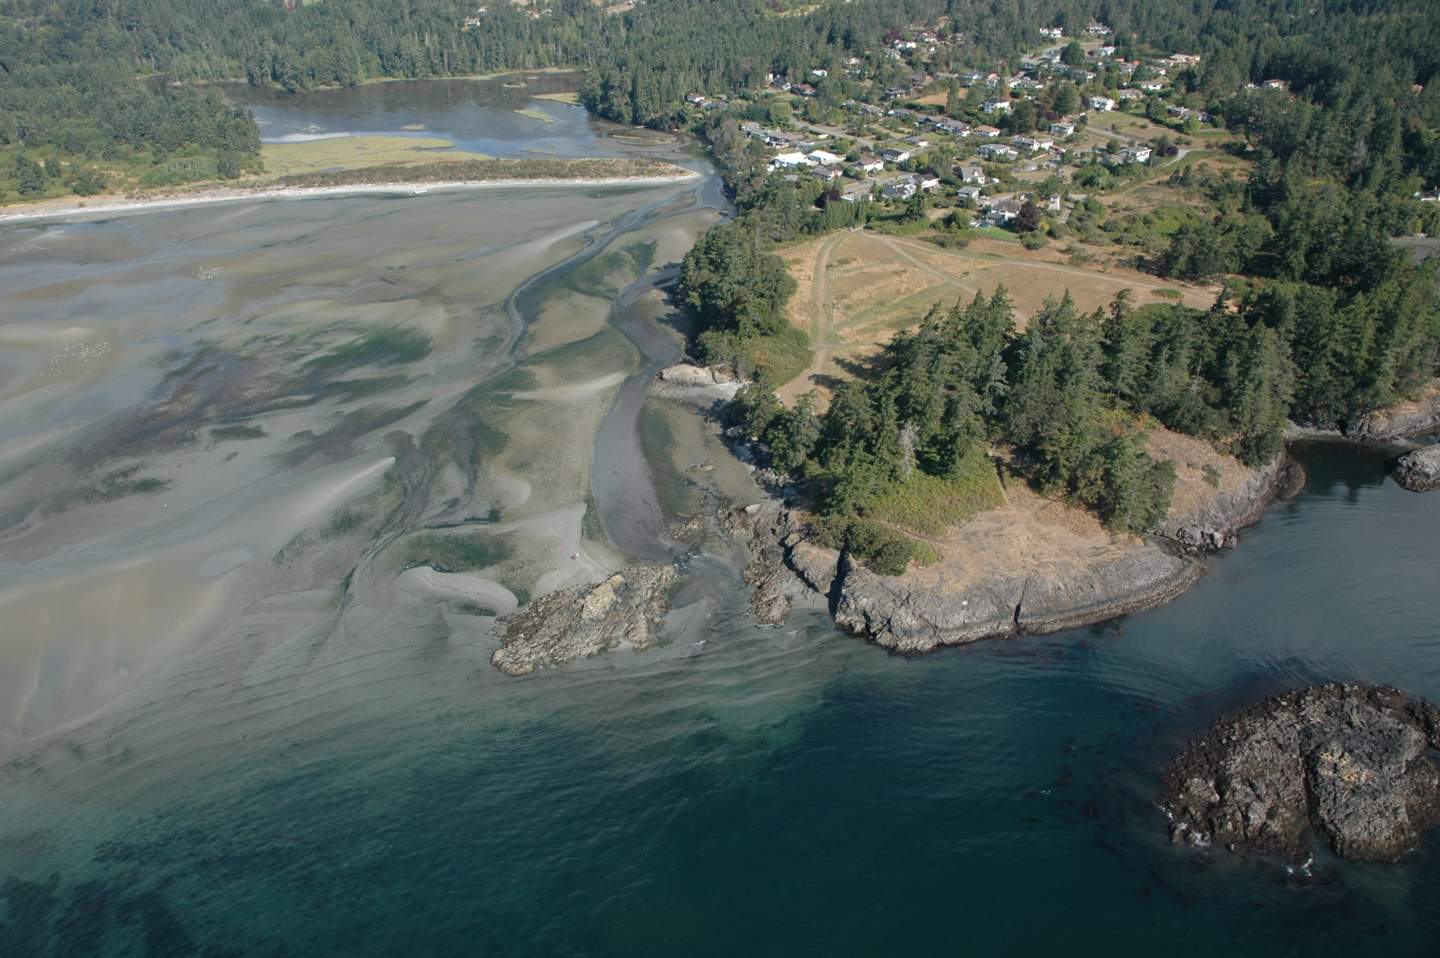
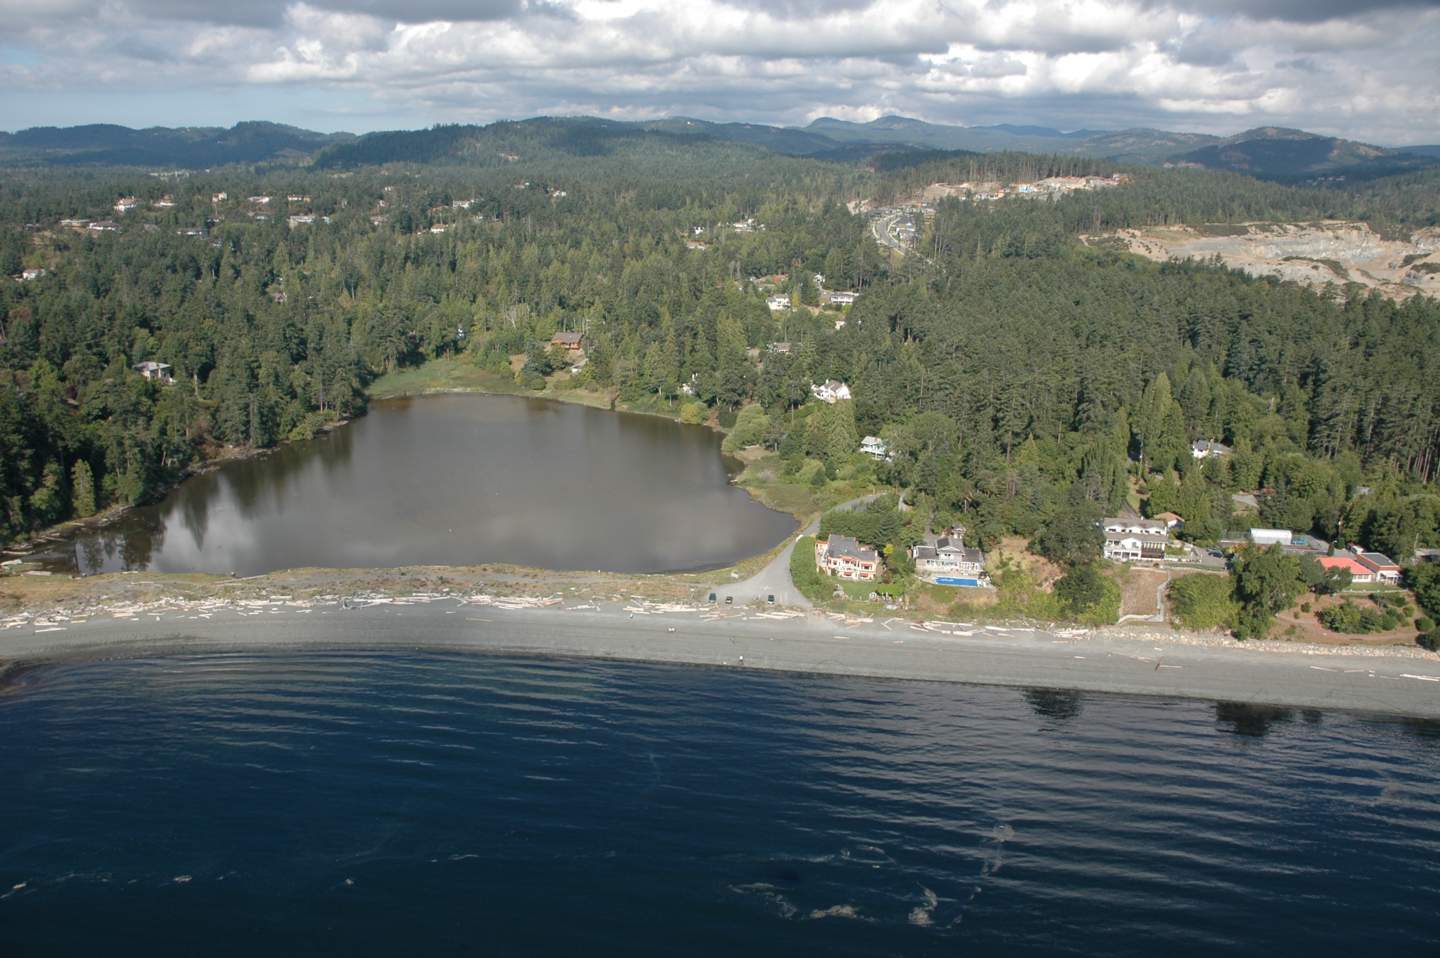
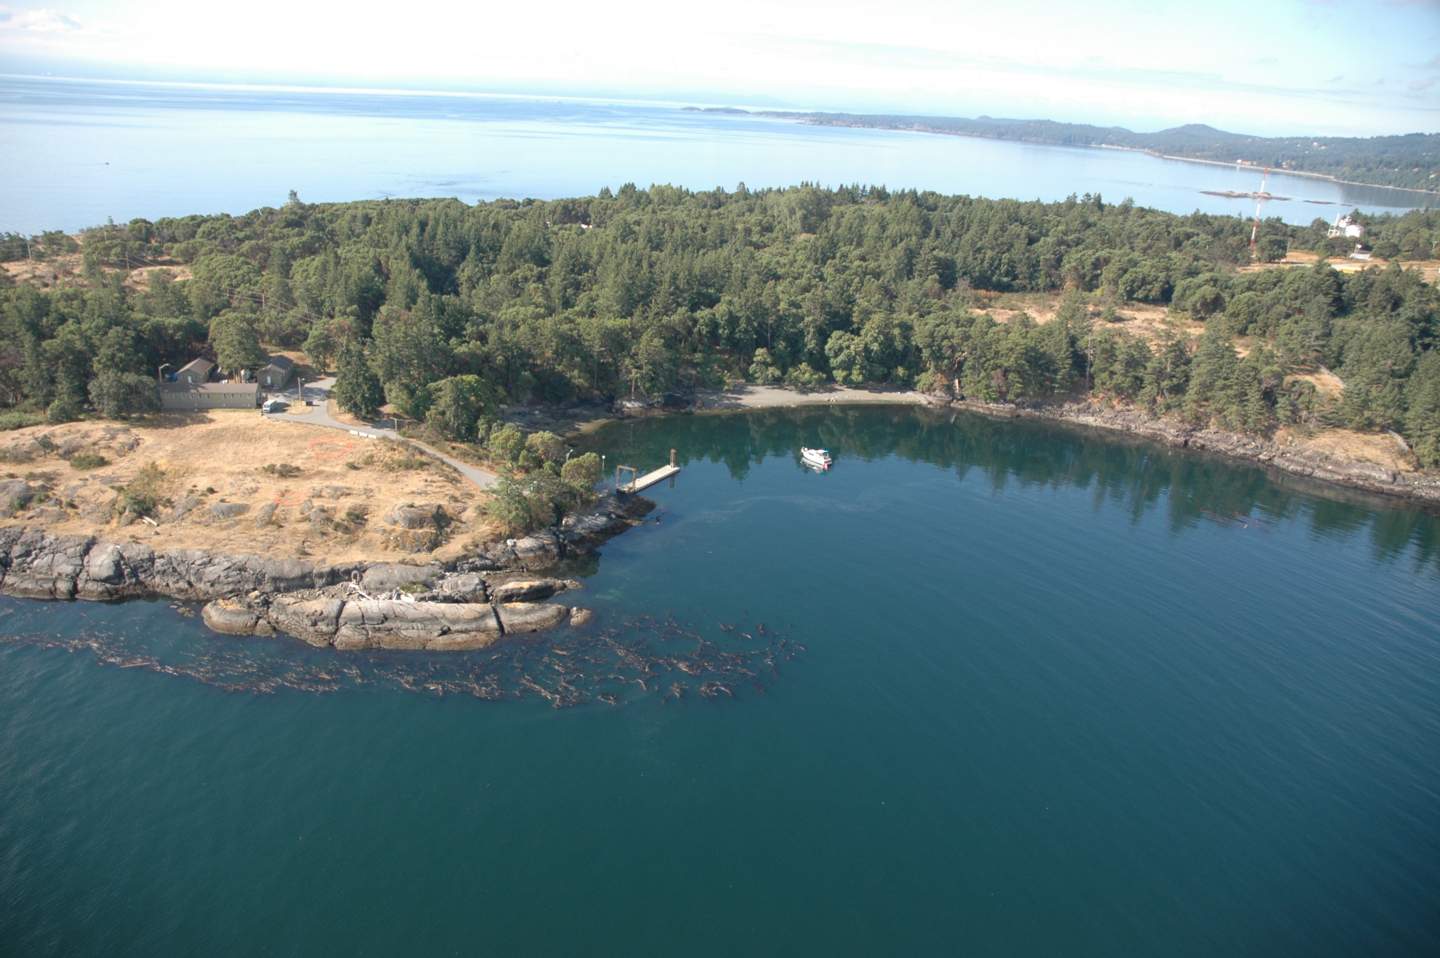
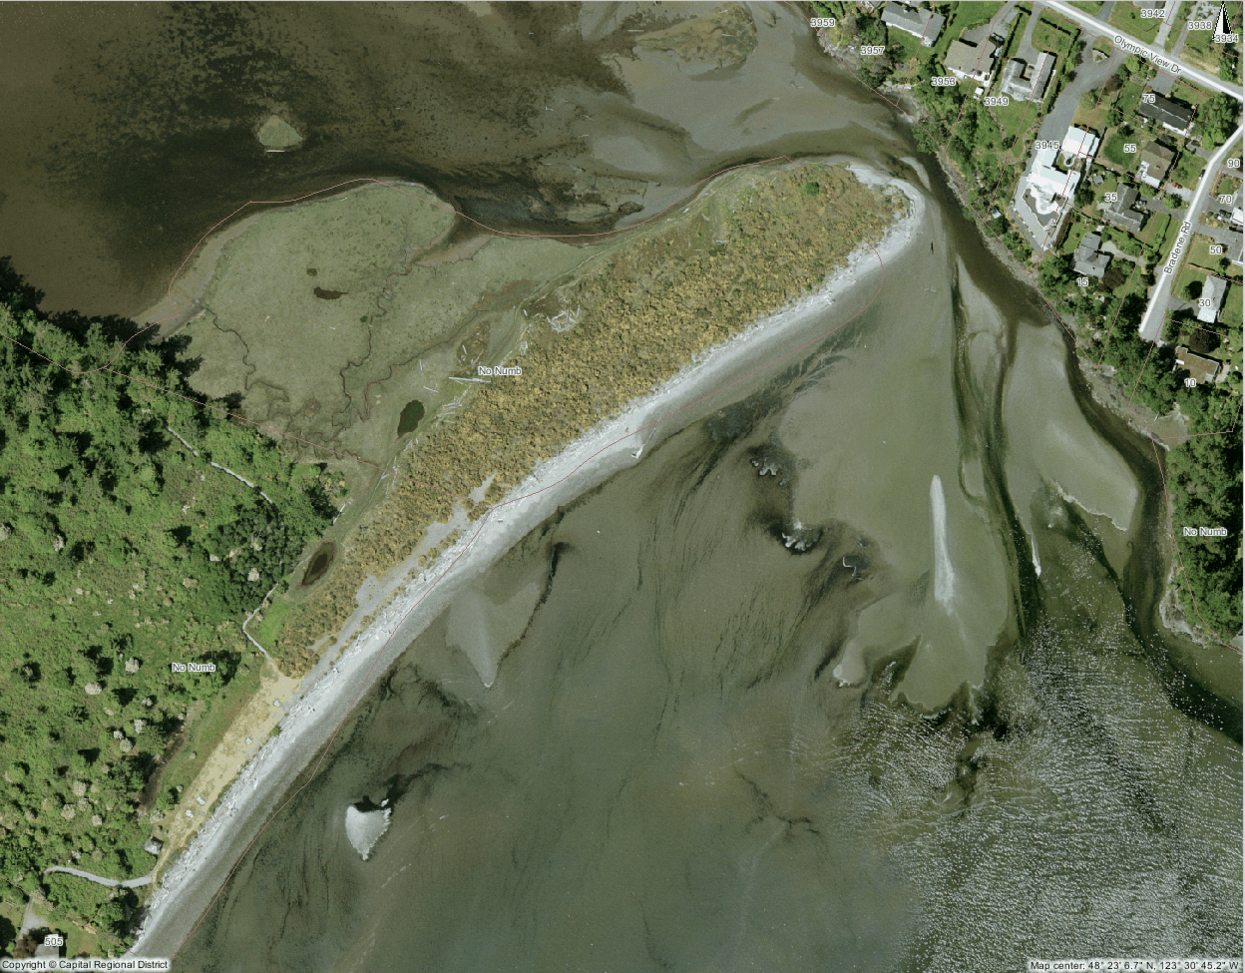
2.3.5 Spit Area:
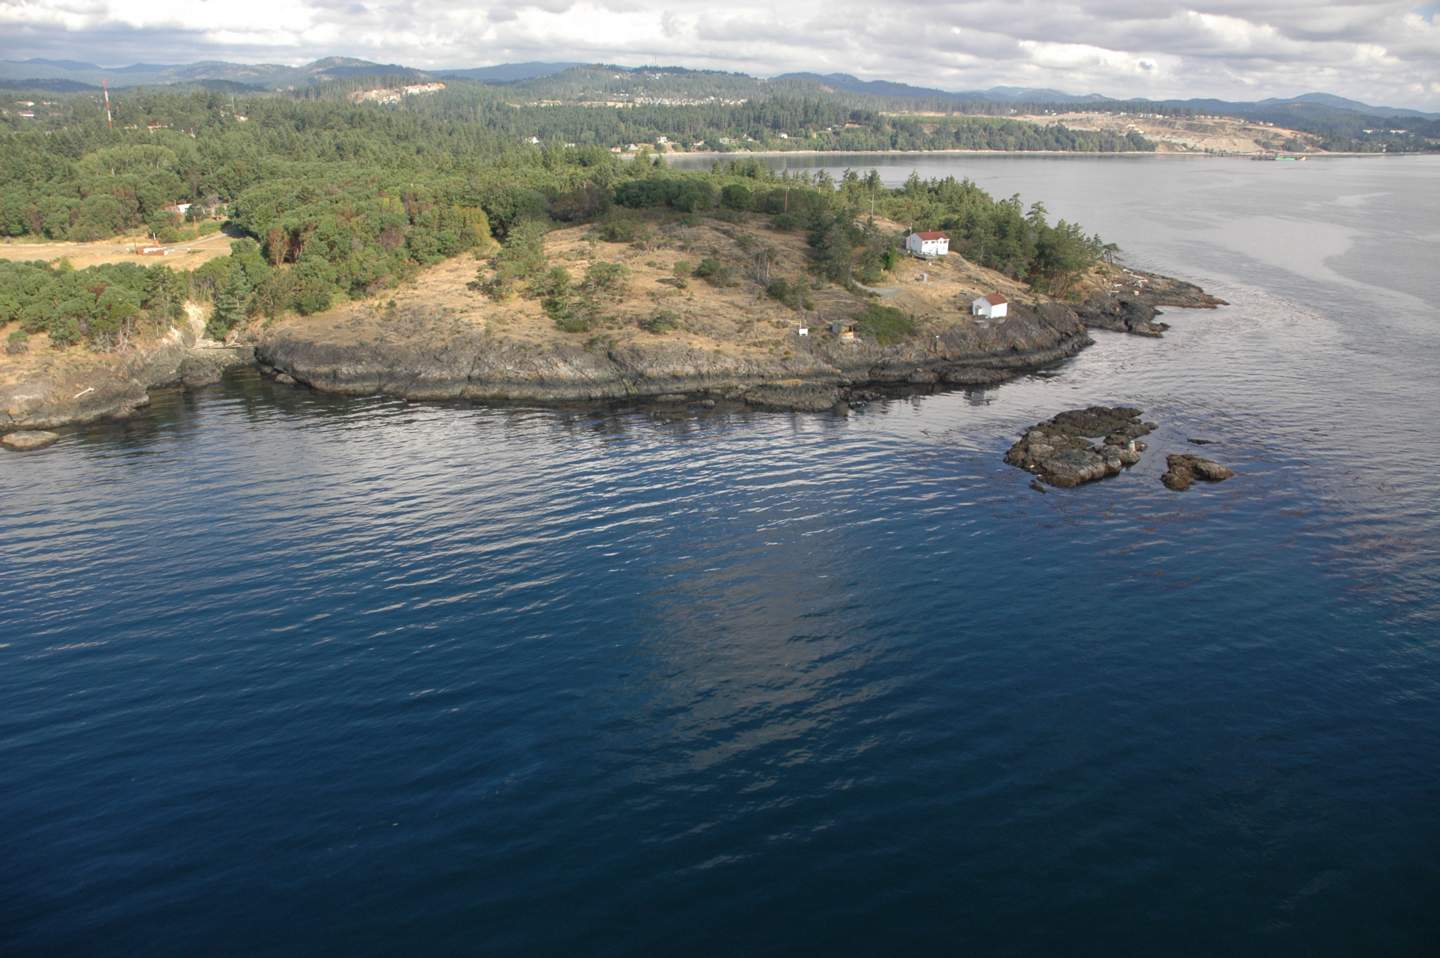
The spit area is the landform that divides the offshore from the transitional high tide area. The sandy bar was 200-300 meters long by 50-75 meters wide. It was formed by wave refraction. Eddies scour the southwest corner and sediments are deposited on the opposite shore at similar rates. Wave action and outflow remove sediment from the beach point at the end of the bar and the bottleneck mouth to the lagoon. This equilibrium maintains the relative stability of the spit landform. The narrow mouth of the lagoon is kept open by the constant flow of water out of the estuary. The salt marsh, adjacent to the spit, is formed by stagnant water isolated from the main outflow energy from the lagoon.

Section 3. Biophysical:
3.0 Overview:
Witty’s lagoon is situated in a coastal bay where the formation of a beach barrier spit has created a lagoon. The biophysical and ecological features include a complex array of ecosystems; the four broad categories of the different types of communities are forest, salt marsh, spit, and, ocean beach. Each ecosystem has its own unique features and inhabitants.

The public access to the lagoon is from either a west or north parking lot. The beach trail down to the lagoon from the north parking lot is adjacent to Bilston Creek which thunders 50 meters down Sitting Lady Falls into the salt water lagoon. The southern trail travels down a steep slope through a rich coniferous forest, past an old overgrown farm homestead, through a salt marsh and out onto a floodplain where the lagoon begins. The trail continues along the flood plain and through grasslands out to a long narrow sandy barrier beach spit. The mudflats extend south of the spit while the salt marsh is on the north side of the beach spit.

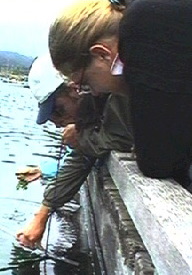
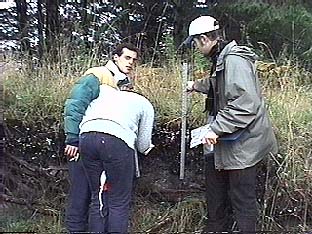
The qualitative field survey techniques included: on-site descriptive observations; field notes; and, species identification of both plant and animal inhabitants and debris by informal transect and quadrat sampling techniques. Visual estimates of distance and per cent coverage were used. One limitation of the preliminary study was that the tide was high which excluded study of the sandy ocean substrate and the lower marsh substrate below the high tide zone. A second limitation of the field techniques used was that nocturnal species were excluded from the daytime observations.

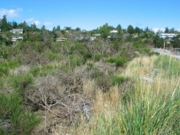
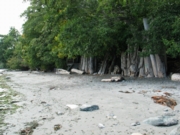
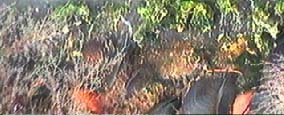
3.1 Attributes of the Douglas Fir Forest and Flood Plain:
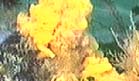
Douglas-fir (Pseudotsuga menziesii), sword fern (Polystichum munitum), and fungi occupy the forest from the canopy to the ground respectively. Douglas-fir is the dominant tree species with 60% canopy cover and an average tree diameter at breast height of 30 cm. The less dominant trees included some old growth and small regenerating Western red cedar (Thuja plicata). There are mature Arbutus (Arbutus menziesii) trees scattered along the edge of the forest adjacent to the lagoon. The roots of the trees adjacent to the lagoon curve down, out, and over the water. This suggests that the soil at the edge of the lagoon has slumped in towards the lagoon, forcing the trees to correct their growth upwards. There are at least four snags, large standing trees which are no longer living, which provide habitat to birds and animals. There are several habitat trees lying horizontally in the lagoon. The forest floor is populated by sword ferns with 40% ground coverage. Low on the moist forest floor there is a wide diversity of mosses and fungi. There were 5 separate species of fungi in a 10 metre random line transect along the forest trail. The fungi ranged from small orange caps, 5 cm tall and 3 cm cap diameter, to very large beige mushrooms, 15 cm tall and 30 cm cap diameter. Green moss thickly blankets the forest floor and tree trunks along the trail.

The trail continues down the slope, which is bordered by thick patches of blackberry shrubs (Rubus discolor) and oceanspray (Holodiscus discolor), to the old farmstead. The old farmstead contains several large apple trees and some big leaf maple trees (Acer macrophyllum). There are traces of the old farm fence still standing adjacent to the lagoon and salt marsh area.

The trail continues across the flood plain which supports shrubs, tall grasses, and a large stand of cottonwood trees (Populus balsamifera), and onto the beach barrier spit. The spit divides the ocean beach on the south from the salt marsh on the north.

Very few species of wildlife were observed in this zone; probably because most of the invertebrates normally found here were difficult to locate due to their small size. It is probable that a wide variety of invertebrates do exist in this area even though only six Banana slugs (Ariolimax columbianus) were observed on the trail to the spit. Terrestrial vertebrates were not observed; however, this terrain is suitable for burrowers and nocturnal hunters.

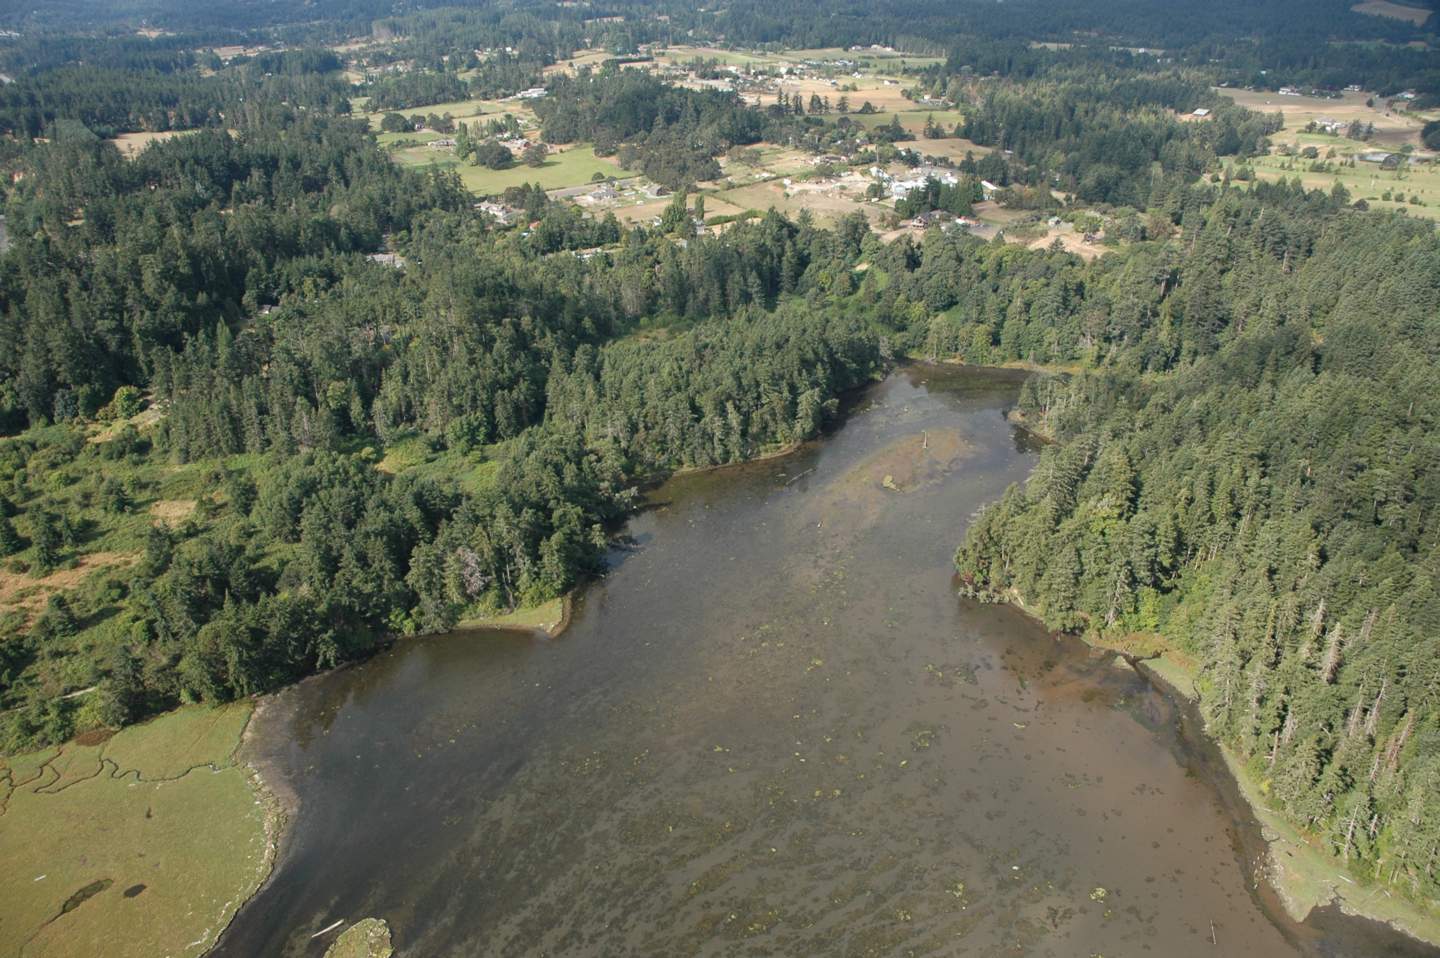
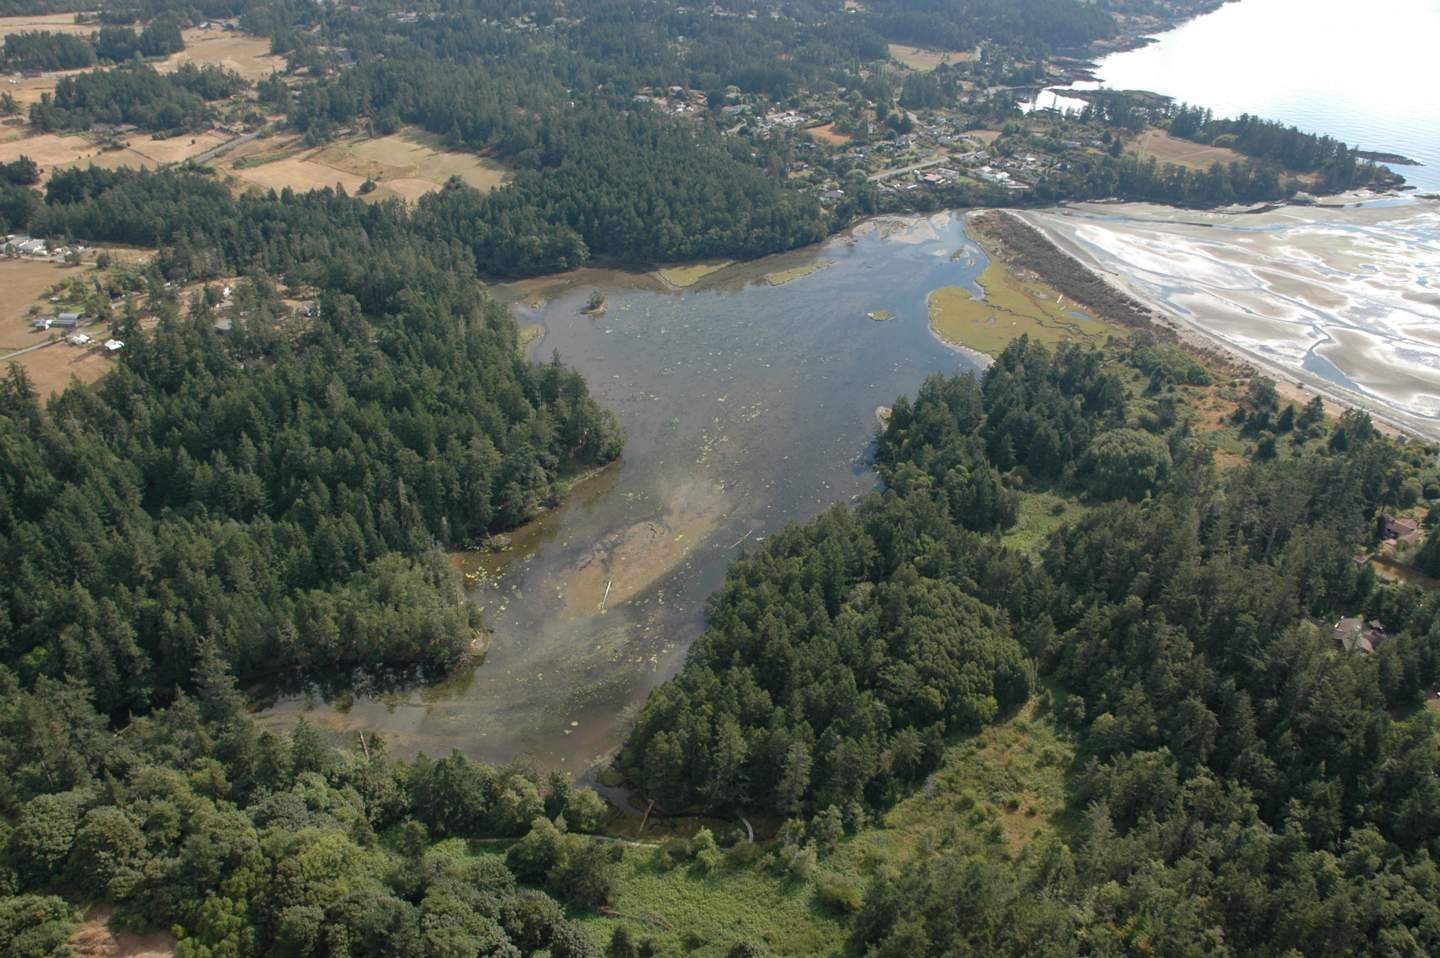
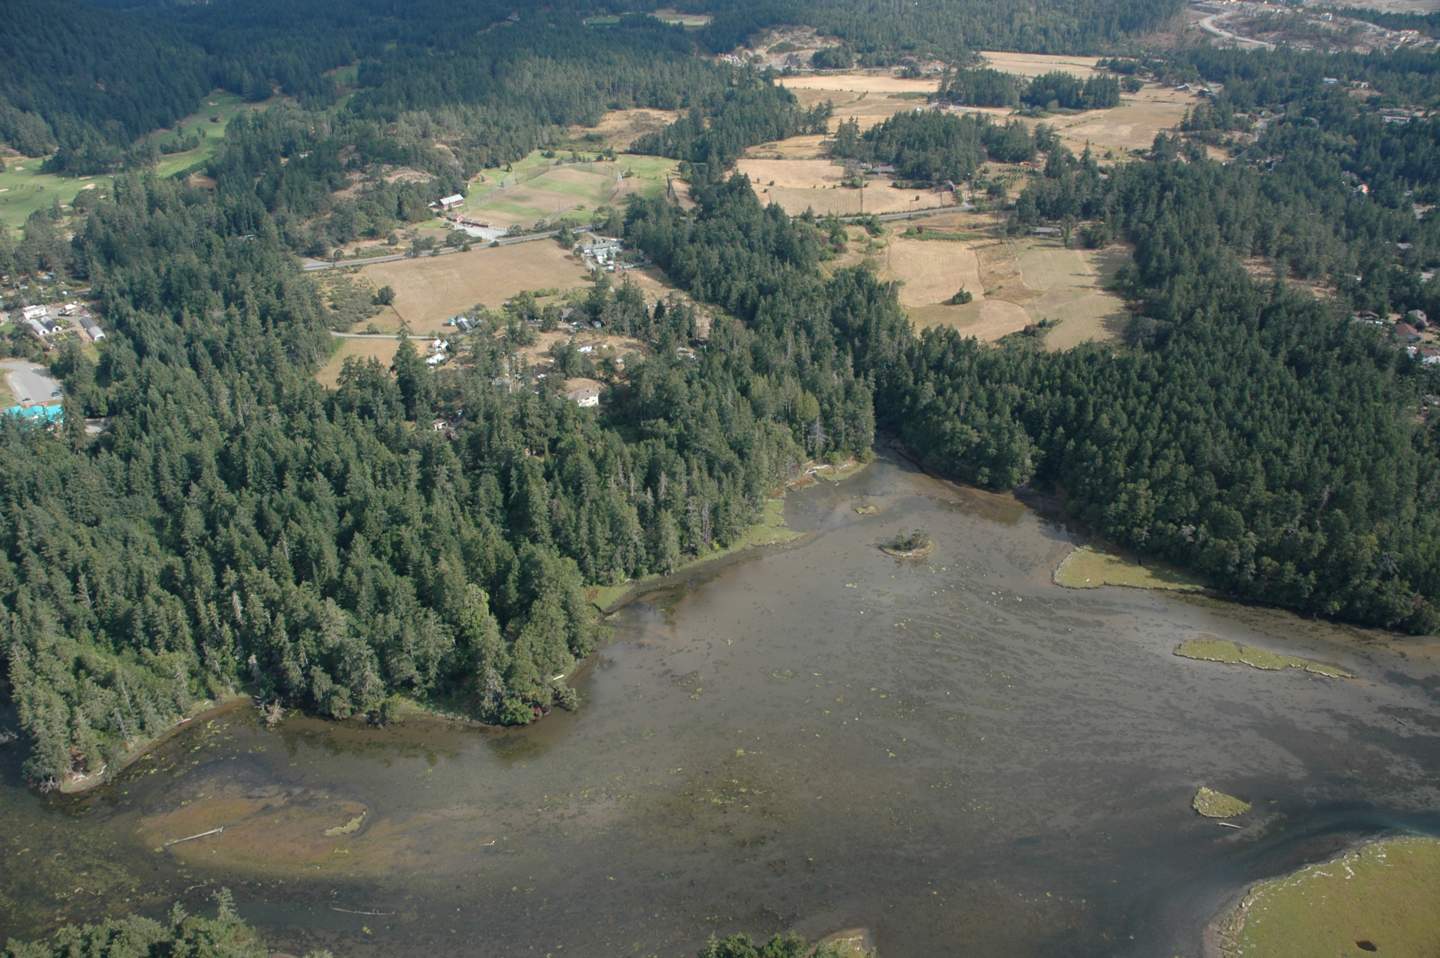
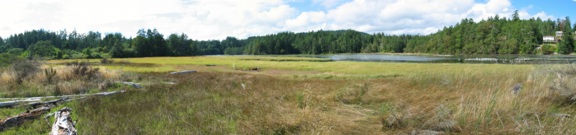
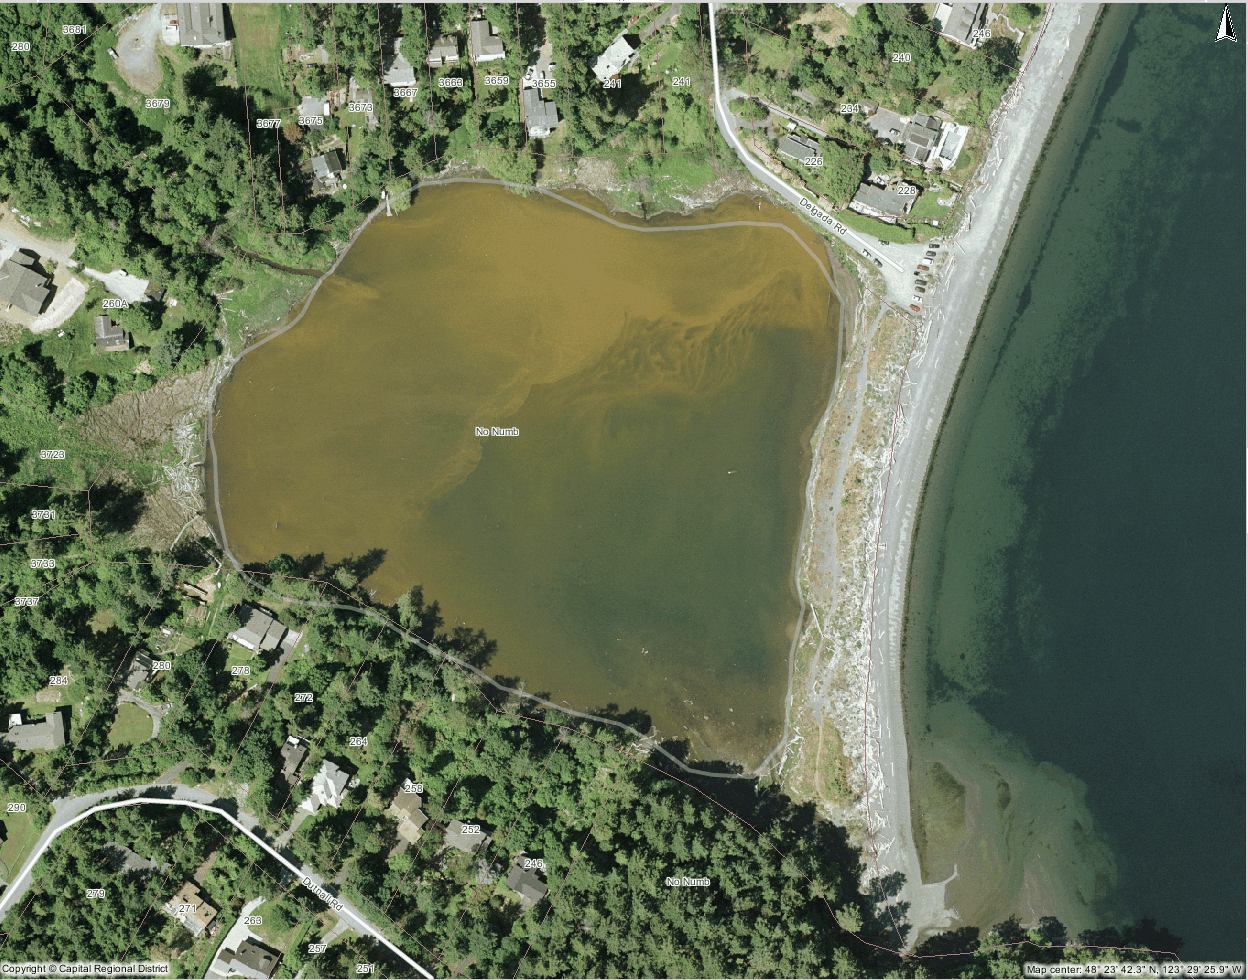
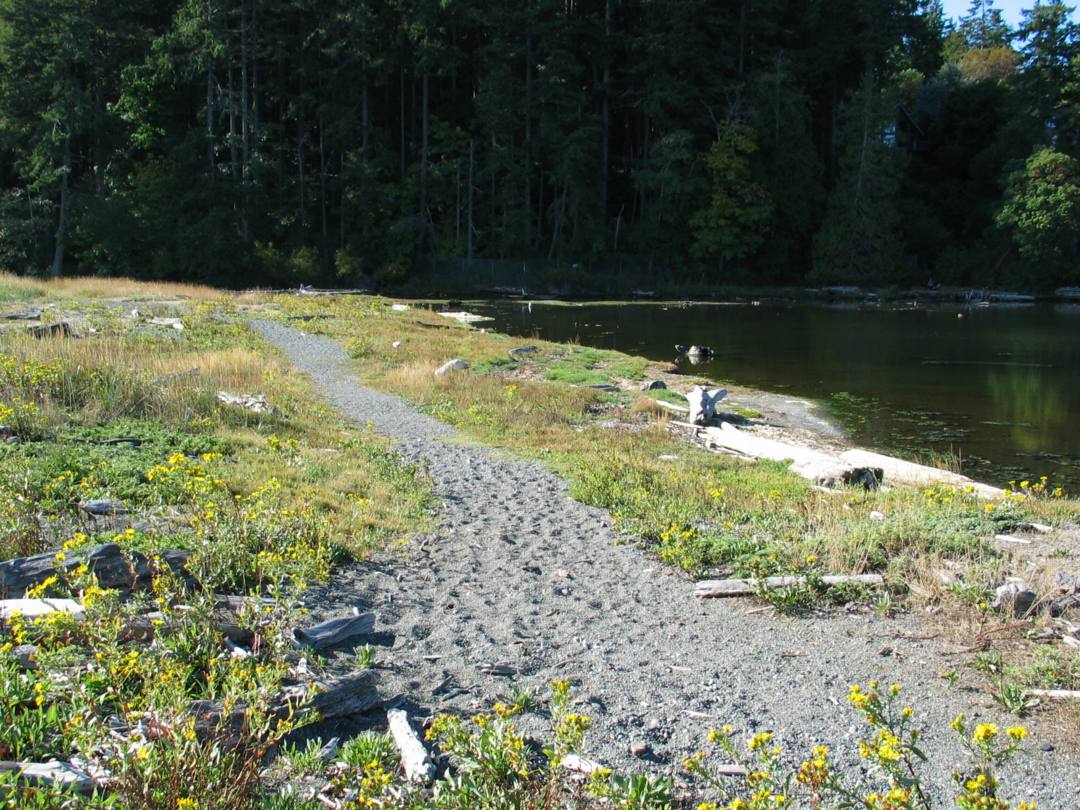
3.2 Attributes of the Salt Marsh:
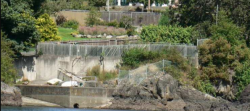
The salt marsh has two distinct types of thick matted grasses. The thick grasses to the north end of the lagoon are brown in the standing water. The lush grasses to the south end of the lagoon are green, tall, and the 1 meter blades bend over forming a thick absorbent marsh bed. The tide was at the high level mark; however, it is possible that the salt marsh drains significantly at low tide level. There are several small islands, possibly of sand or rock, in the center of the lagoon covered with brown grasses. The north region of the lagoon is ringed by forest, brown marsh grasses, and log debris. The west region of the lagoon is flanked by a man-made sea wall and residential homes.

The north end of this sea wall is dominated by a 30 meter tall snag tree which stands out against the forested slope. The north area of the lagoon receives the highest volume of fresh water from Bilston creek. The south area of the lagoon receives the highest concentration of salt water from the ocean, and this is the area where the most of the salt water tolerant species of grasses are located. In addition, the marsh grasses must be tolerant to wet and dry periods during high and low tides. Large logs that are sparsely scattered across the deep grasses on the marsh side were probably deposited during severe winter storms with very high energy to move these logs over the spit to the protected leeward side. The edges of the marsh grasses are marked by narrow gentle slopes of fine clay like material into the lagoon.

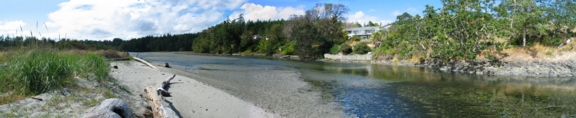
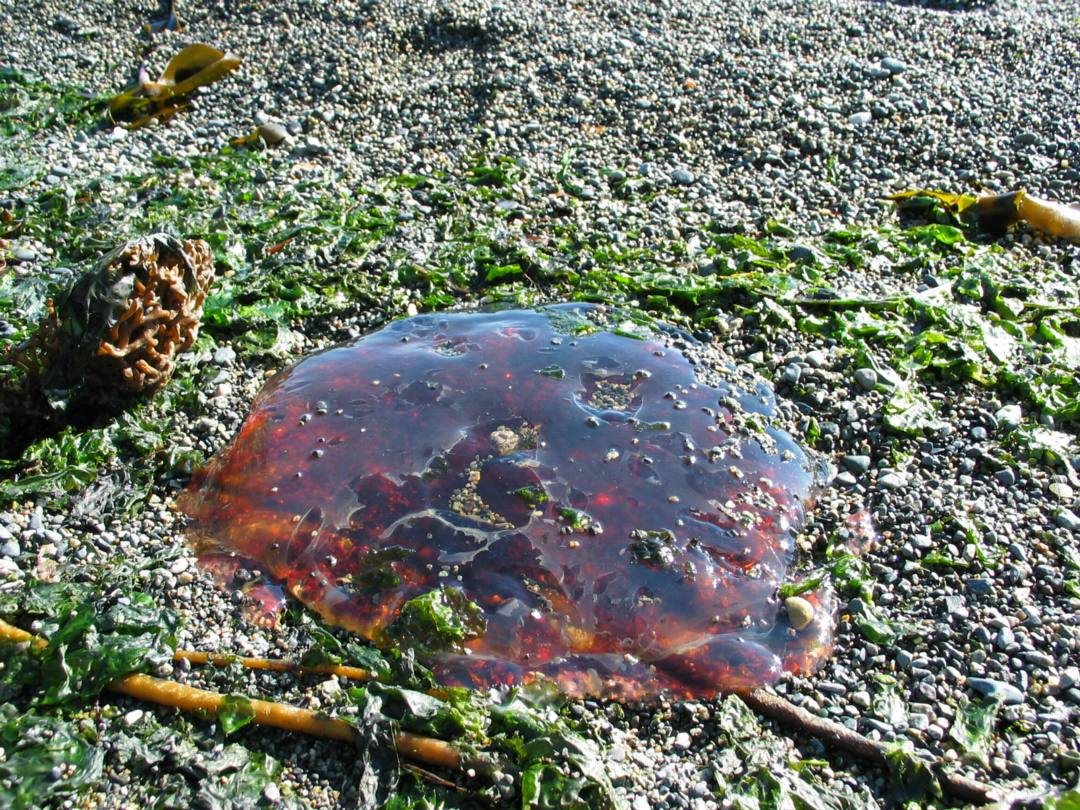
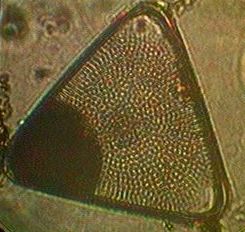
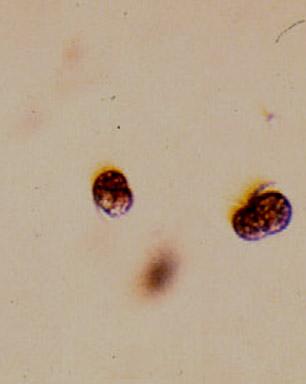
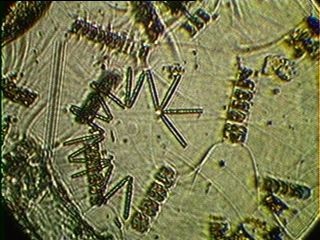
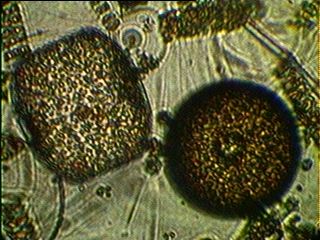
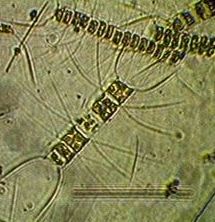
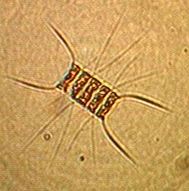
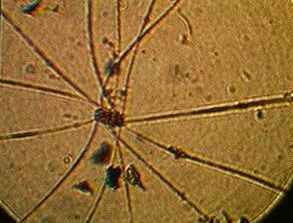
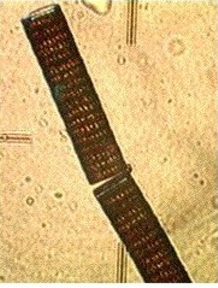
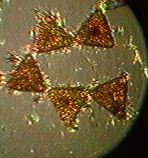
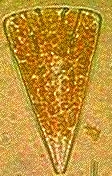
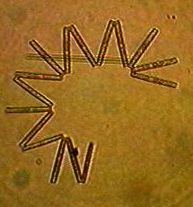
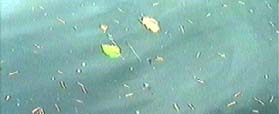
The brown water of the lagoon on the surface was still and calm. The swiftest flow of water is found at the south east end of the lagoon in the narrow channel, which is 20 meters across, where the ocean water flows in and the fresh water flows out. Here the water colour is a deep reddish brown, with a distinct line of coloration 1 to 2 meters below the water’s surface. The dark red colour may be attributable to tannins in the detritus of the fall leaves, or speculatively, may be due to an algae bloom event. An algae bloom event is caused by a population explosion of dinoflagellates. At this end point, the spit forms the bottle neck to the lagoon and provides protection from onshore winds and waves.

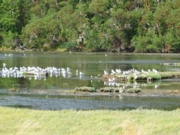
There was a wide variety of birds observed within the salt marsh. Table 1 lists the wildlife observed within the lagoon in order of decreasing dominance. Herring gulls (Larus argentatus), Glaucas-winged gulls (Larus glaucescens) and Mallard ducks (Anas platyrhynchos) were the dominant species within the lagoon. The ducks and gulls tended to flock together with respect to species and were observed feeding and swimming. A Cormorant was seen standing on a piece of driftwood floating on the lagoon while two Kingfishers were feeding nearby. Jays and Stellars Jay were observed flying over the lagoon and landing on one of the grassy islands. A Loon was also seen floating on the water. The wide variety of birds and bird types indicate an abundance of food, diversity of habitat, and the sheltered nature of the area.

Table 1. Species Observed in Salt Marsh

Table 1

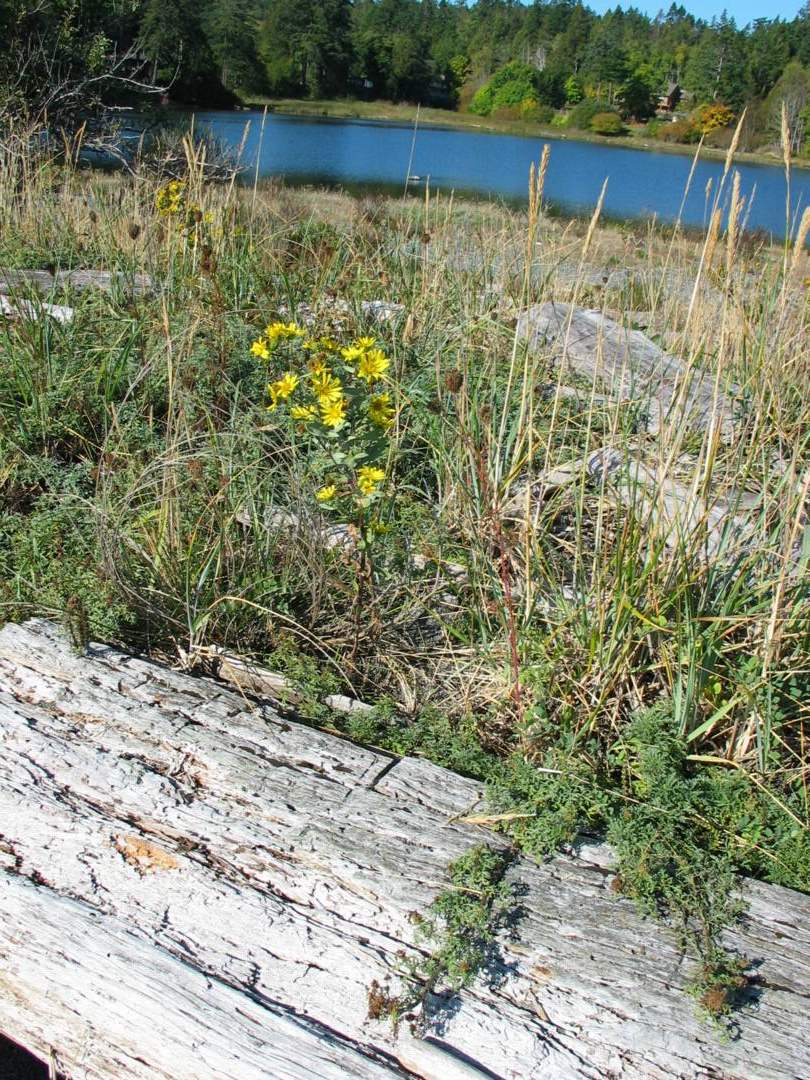
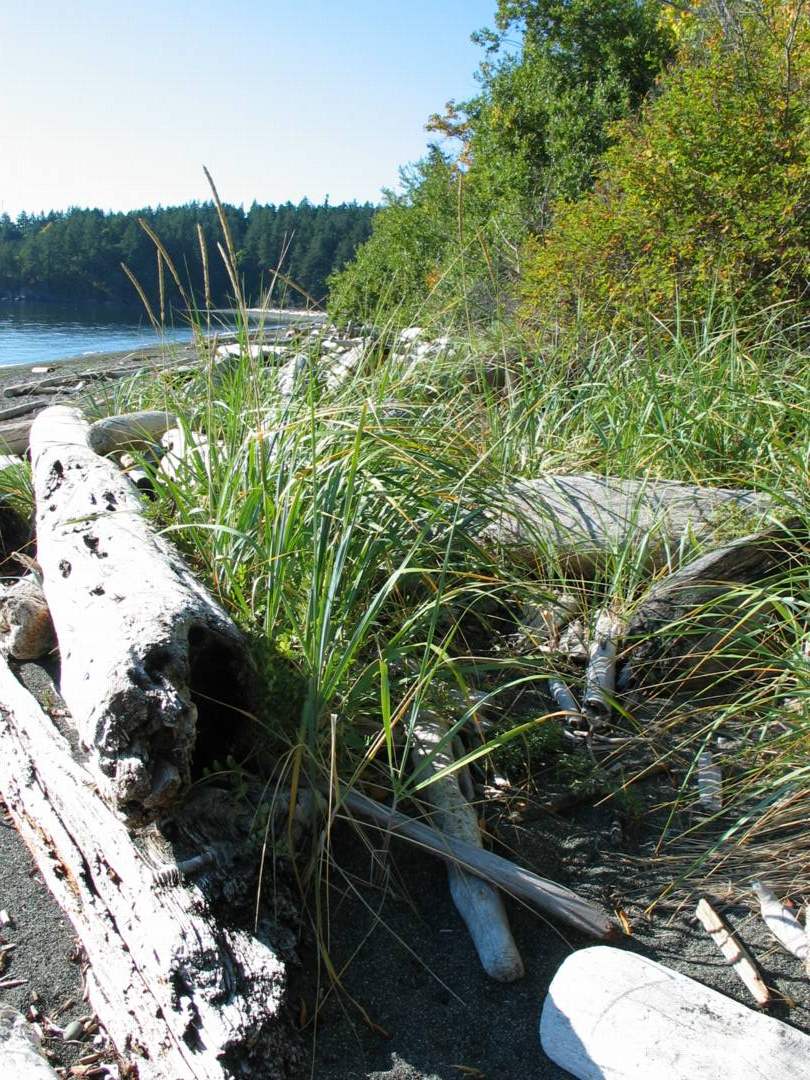
3.3 Attributes of the Terrestrial Spit:
The beach barrier spit is accessed from the beach trail across the flood plain or from the stairs down from the west parking lot. The spit is 200 to 300 meters long, from west to east, and 50 to 75 meters wide, from north to south. The most notable feature on the terrestrial area of the spit is the dominant growth of scotch broom (Cytisus scoparius), covering 90% of the terrestrial area of the spit. This is an exotic species that was introduced to this area about the time the old farmstead was established. There is a variety of other shrubs, herbaceous plants, and thick grasses below the canopy of scotch broom. The picnic area near the west end of the spit is covered by short grasses. The spit rises slightly in the center; gentle slopes ease down on each side, towards the lagoon on the north side and towards the ocean beach on the south side. The peak altitude of the terrestrial portion of the spit is 5 to 7 meters above the high tide mark of the sandy beach.

The dominant faunal species in this zone was the Sand Flea. An almost infinite number of fleas and flea burrows were observed throughout the area. Walking quietly through the interior of the spit bar, two unidentified species of nesting birds were observed; a small nest and droppings found in the area are believed to house the birds. Red and black ants from the Order Hymenoptera were observed up to about 2 meters away from the anthill colony. Table 2 lists the species found in order from most plentiful number of organisms to of lesser numbers in population.

Table 2. Species Observed in Barrier Spit Bar
Table 2

3.4 Attributes of the Sandy Beach and Nearshore Marine Zone:
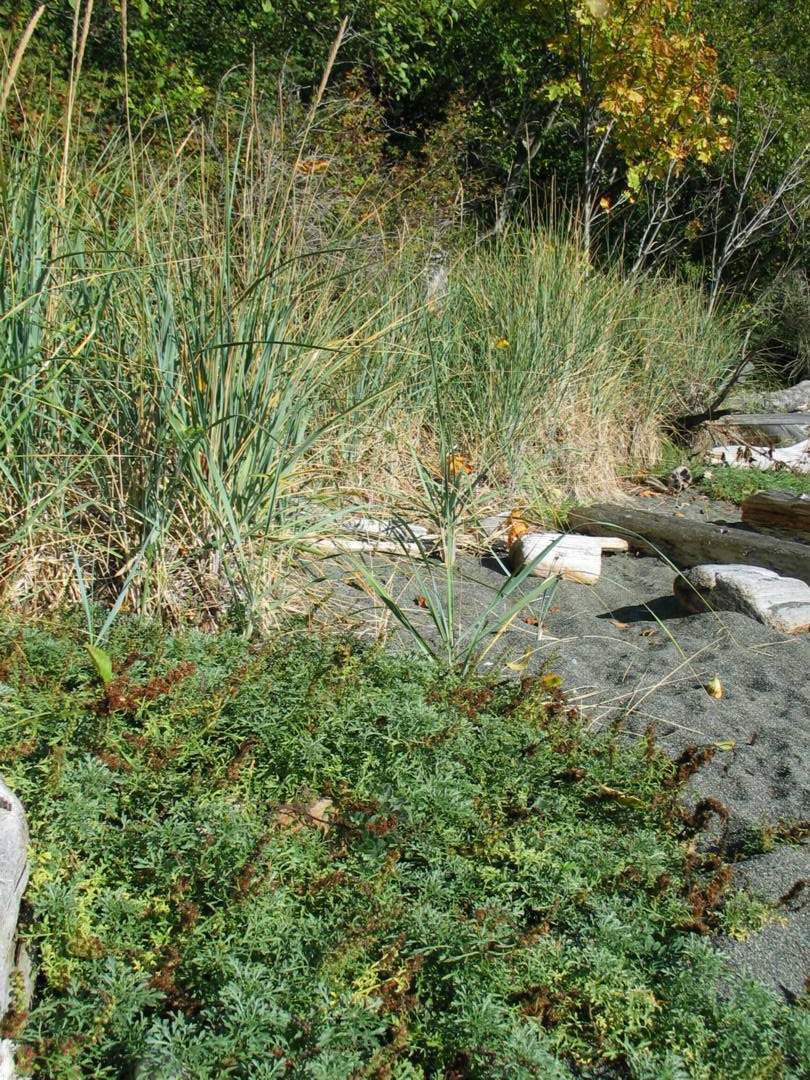
The narrow storm beach is subjected to high wave energy. The upper edge of the spit at the beach line is dominated by grasses in the humic top soil. There is an interesting band of 10 to15 cm diameter rounded cobble just below the humic line. One could speculate that this band of cobble is an anthropogenic enhancement to deter erosion of the top soil; however, the band of cobble lies below the humic stratification layer and is also found in the ocean sand below the high tide mark. This is additional evidence that this is a very high energy beach, commonly known as a storm beach.

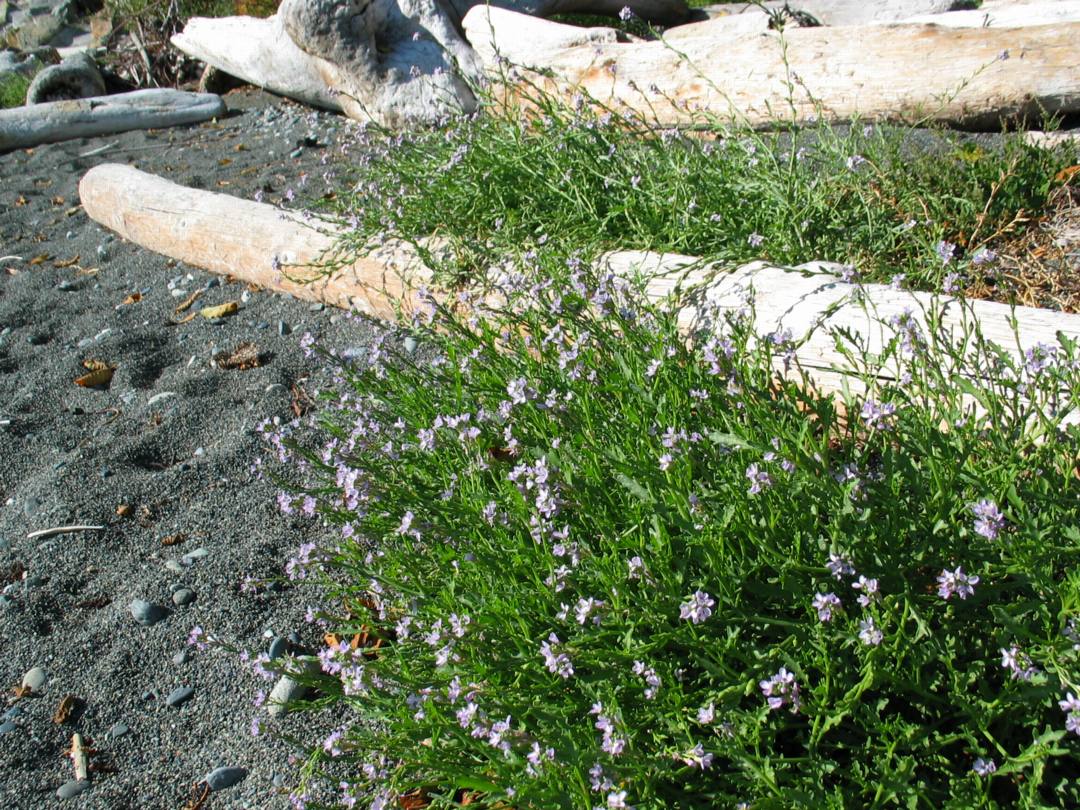
The dominant vegetation at the top of the spray zone is salt tolerant and is likely spear grass or rye grass forming a band along the length of the spit. Adjacent to the grass band is the storm high tide line marked by extensive log debris along the entire length of the spit covering 40% of the sandy beach surface area at high tide.

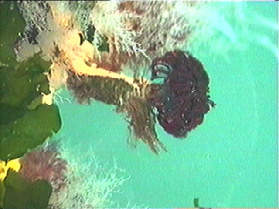
Adjacent to this band of logs there is a band of ocean debris which covers 10% of the sandy beach surface. The ocean debris at this tide line is primarily seaweeds (algae) deposited by wave action onto the beach shore; however, there was anthropogenic debris including a plastic hair brush and a plastic coca cola classic bottle. The algae in the debris are indicators of the plant communities and associated substrates that exist nearby in the intertidal zone below the high tide water level.

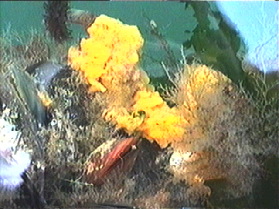
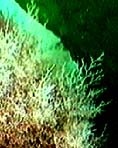
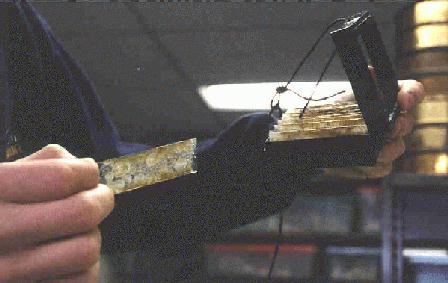
The algae phyla included chlorophytes (greens), phaeophytes (browns), and rhodophytes (reds). There were delicate pieces of green algae; long pieces of brown bull kelp (Nereocystis lutkeana); and small multi-branched chunks of reds. An interesting specimen collected from the seaweed debris was a coraline red algae; bleached white, with small scale-like calciferous sections branching from a common base. The calciferous walls protect the algae from grazing predators.

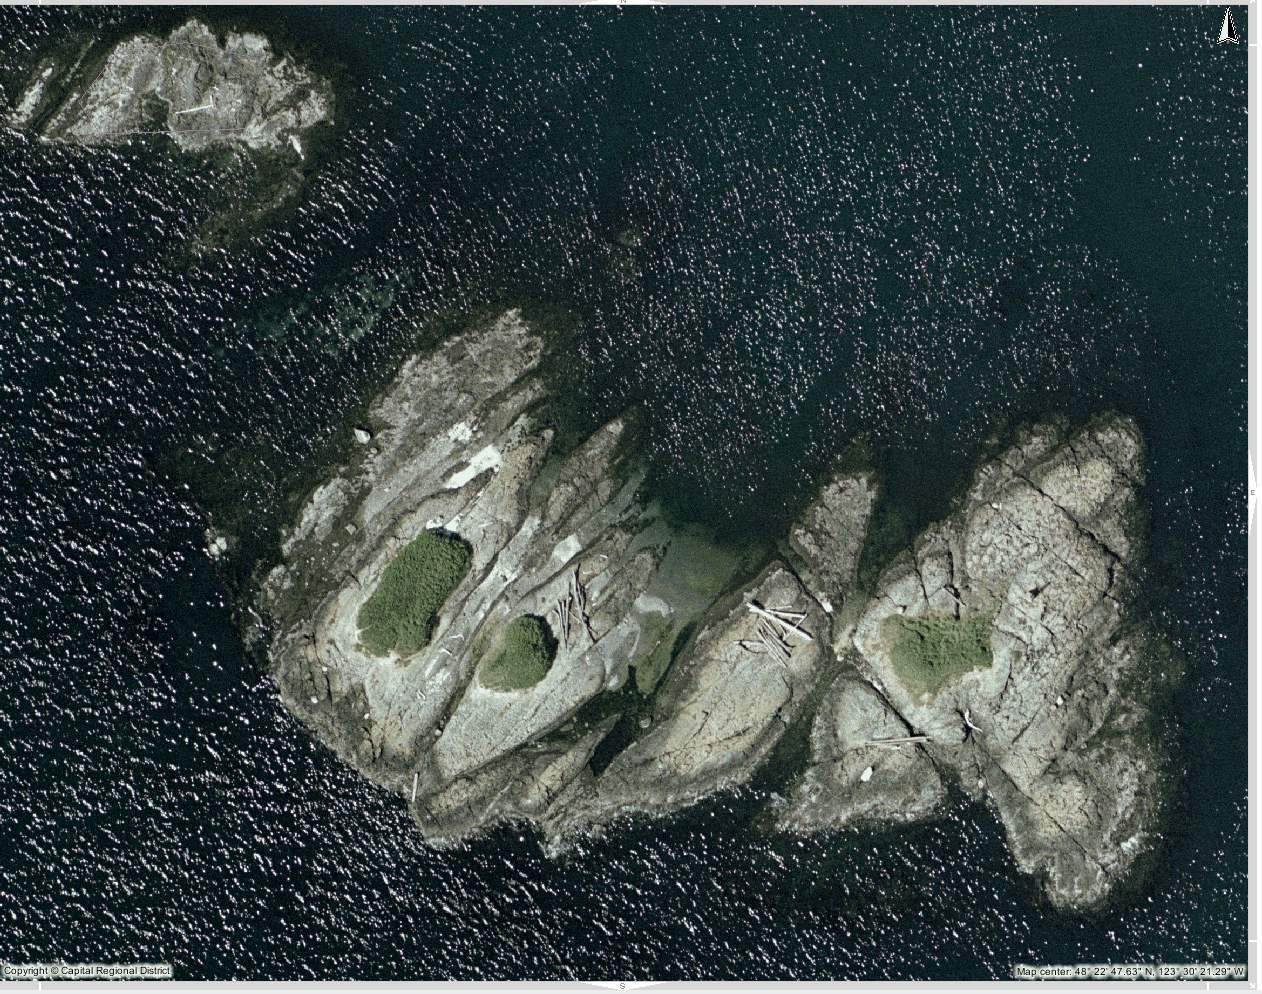
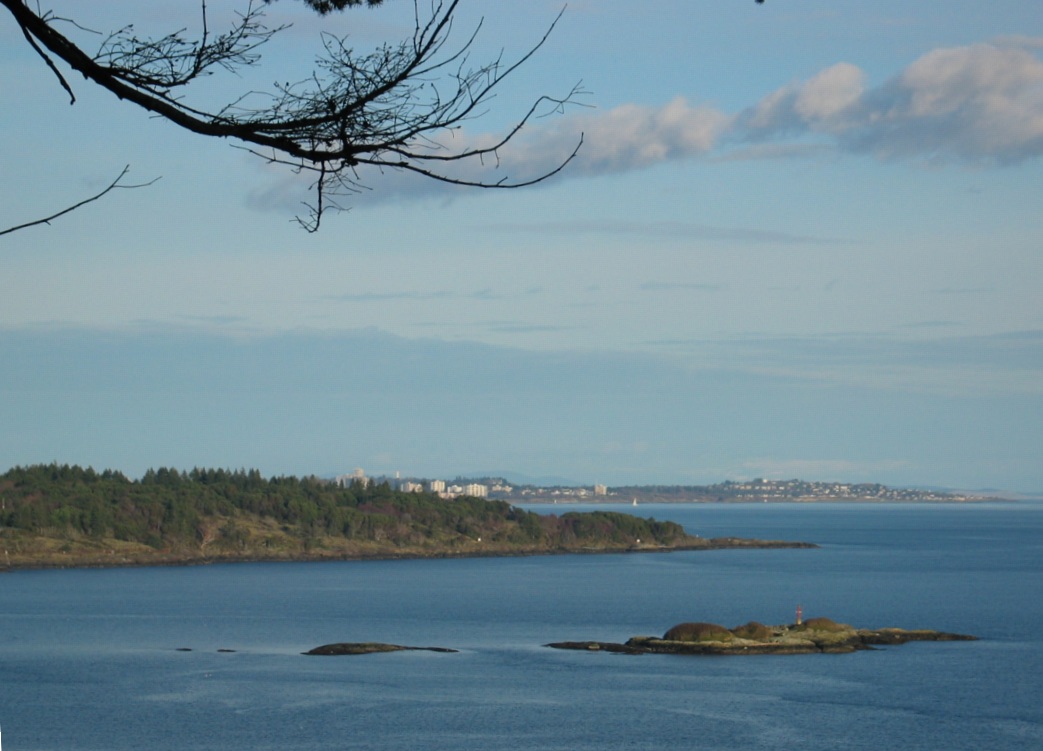
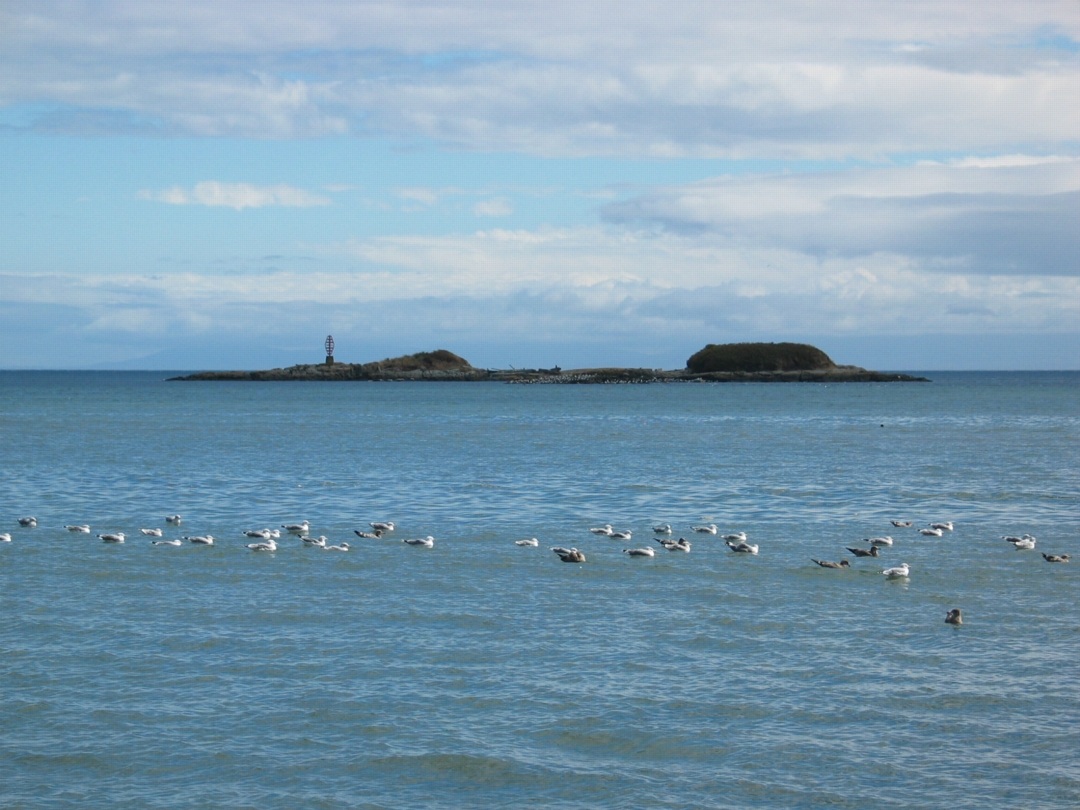
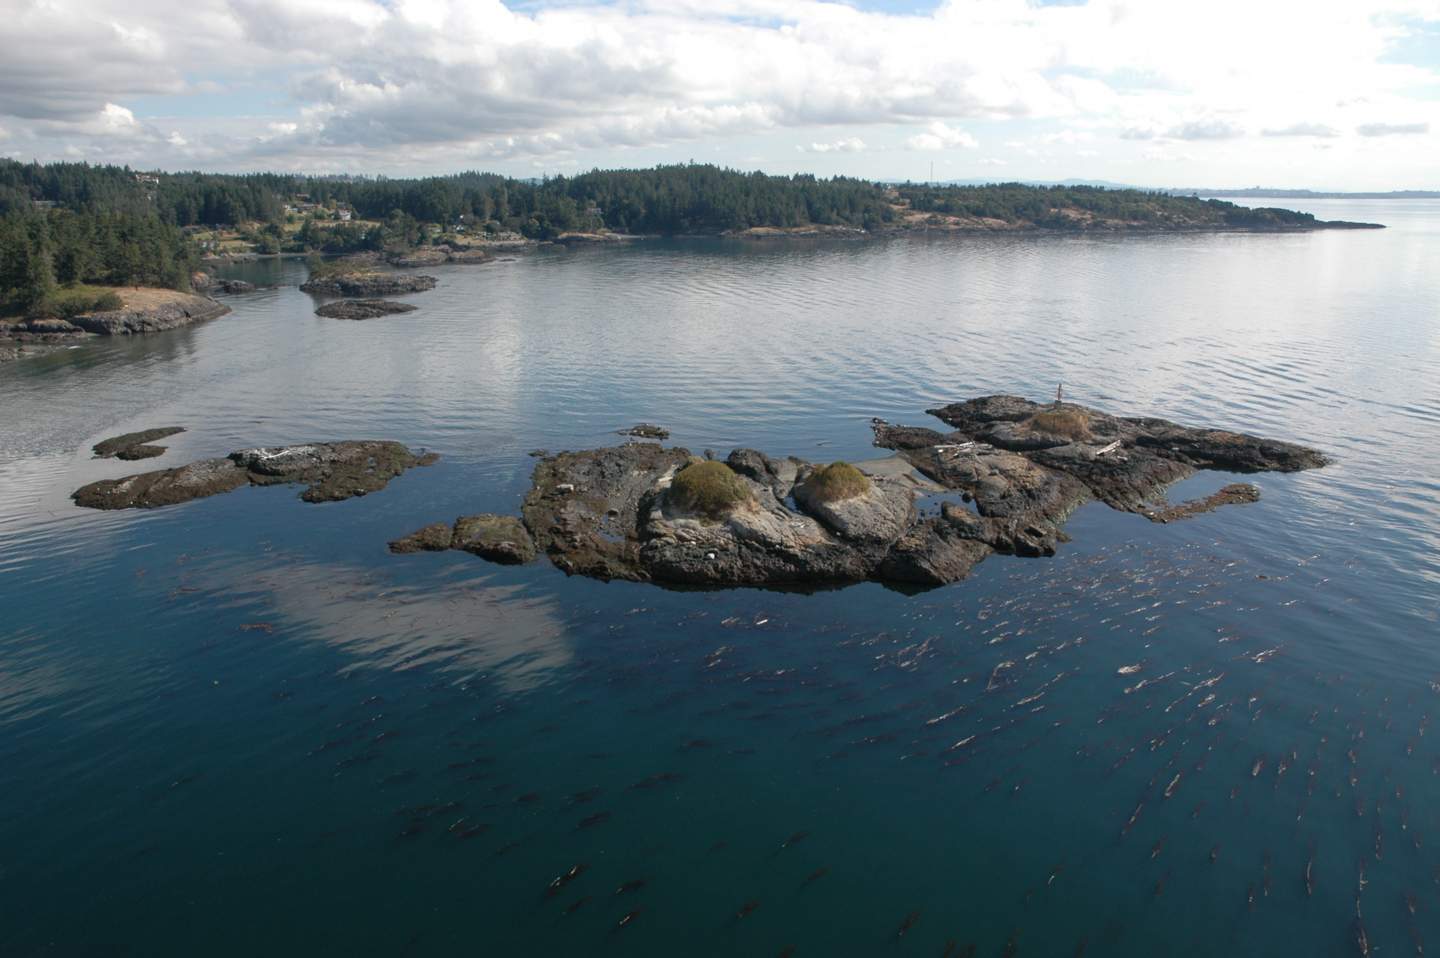
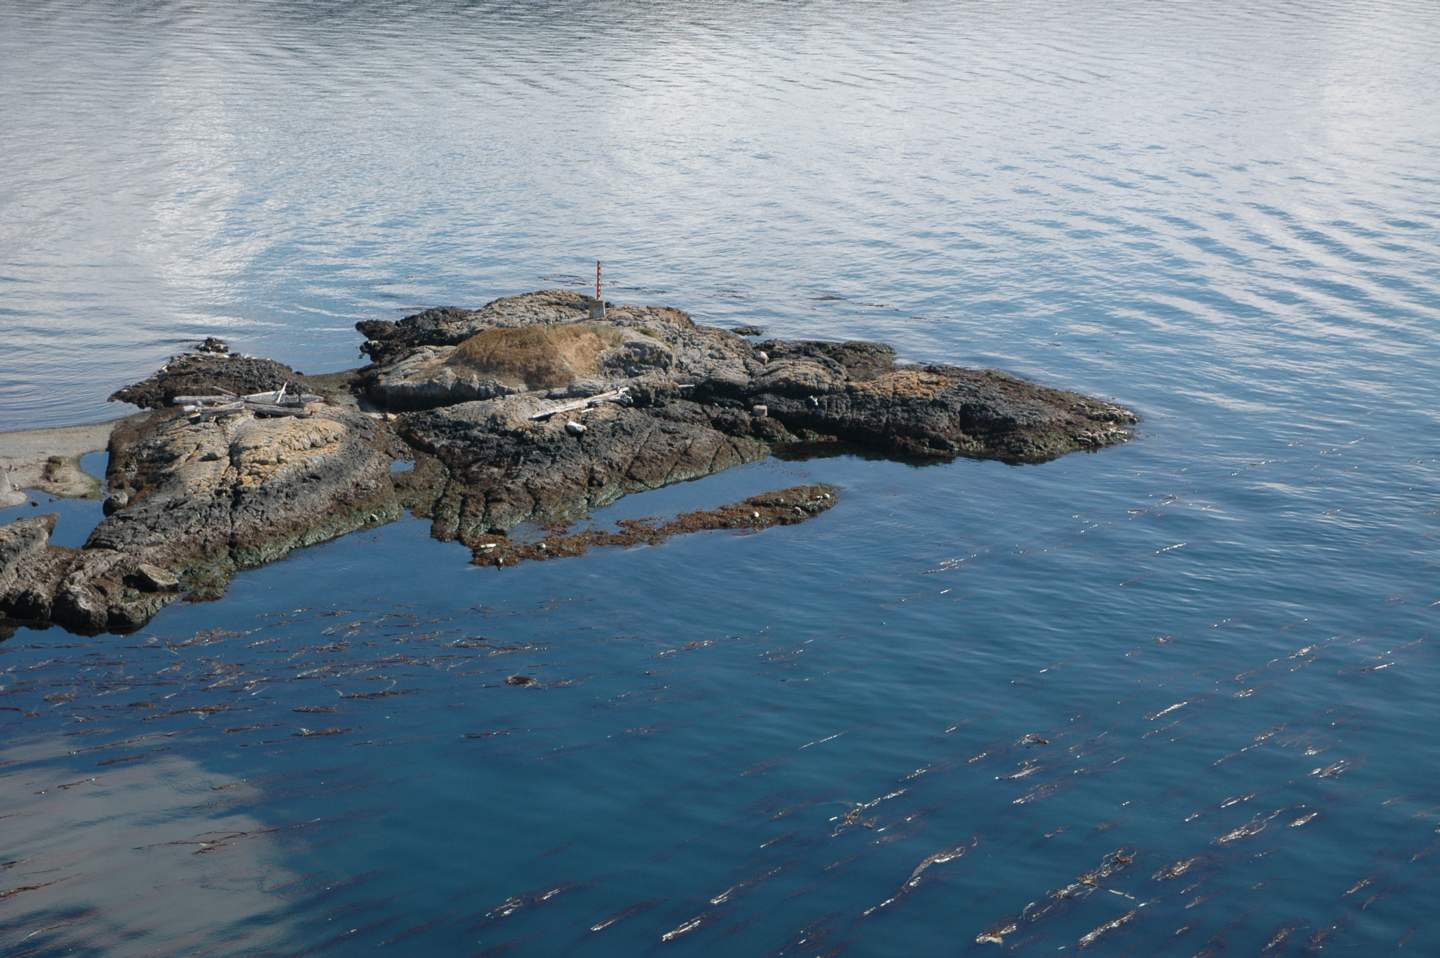
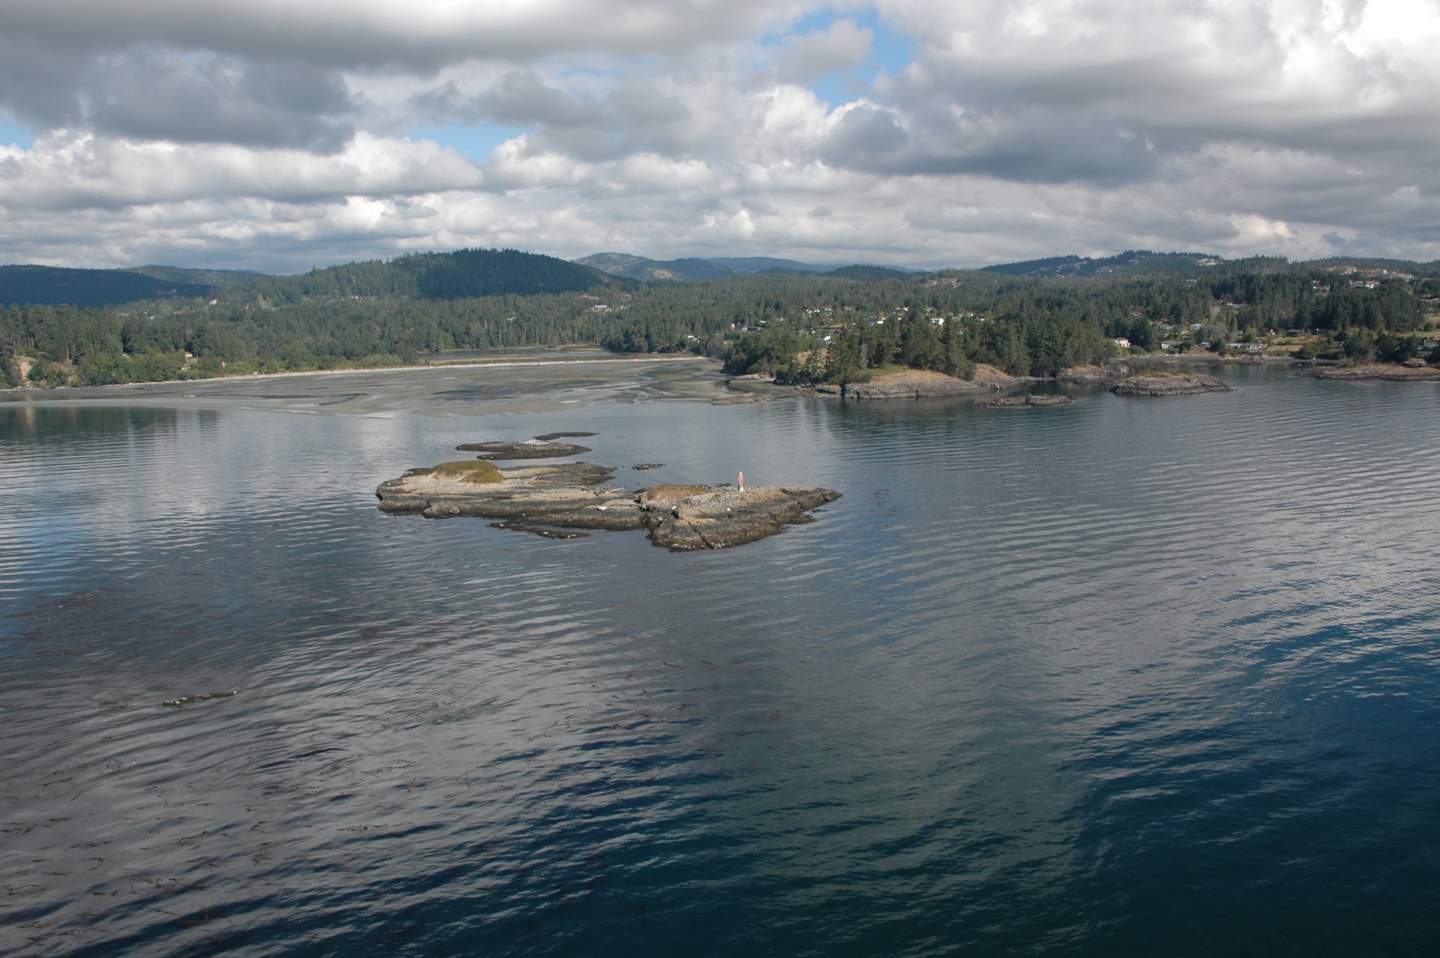
The seaweed debris is deposited upon a fine sandy beach which slopes gently southward down to the ocean. The beach matrix is 95 % fine grained sand with very few small rounded pebbles near the high tide line; however, there is a band of large rounded cobble in the intertidal zone which suggests deposition by high wave energy. The intertidal zone extends southward to a small rocky island 500 meters offshore from the beach. The island has 30% cover of grass vegetation and 50% cover of seagulls.

Sand fleas were the dominant species in the sandy beach zone. Table 3 lists all organisms observed in this area.
Table 3. Species Observed on the Sandy Beach and in Nearshore Marine Zone
Table 3

The majority of the fleas found were observed feeding on seaweed on the beach. A harbour seal pup carcass was found at the northeast tip of the beach. Hundreds of white maggots, about 0.5 cm in size, were feeding on the seal carcass. There was no evidence of internal organs remaining as the carcass was lying nearly flat on the beach. Part of the spine and skull were exposed and partially bleached indicating the seal pup had been dead for some time. The cause of death is unknown but may have been caused by a collision with a boat causing a fatal head injury, or many other possibilities. A sun bleached half jaw bone was also found near the seal carcass. The seven sharply pointed teeth and no grinding molars for vegetable mastication suggests that this was the jaw bone of a carnivore, possibly part of the seal’s jaw.

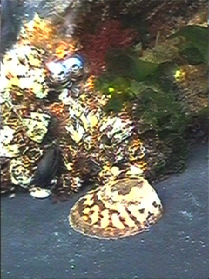
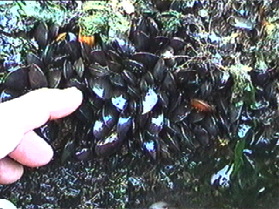
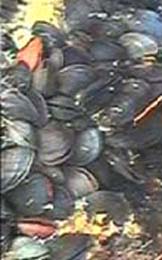
Three species of clam shell debris were scattered over the entire length of the beach, one of which was identified as the Native Littleneck clam (Protothaca stamiea). The sandy substrate of the nearshore beach zone would support a population of clams. One swimming scallop shell was found and would also have been deposited on the beach from the sandy substrate of the nearshore marine environment. Several small Acorn Barnacles(Balanus glandula), about 0.5 cm diameter, were found on pieces of driftwood washed up on shore. None of these barnacles were alive. A large Bull Kelp holdfast was encrusted with 5 very large (2.5 cm diameter) Acorn Barnacles, one of which was still alive. The barnacles are often present on a rocky substrate in the nearshore marine zone.

There were Polychaete worm tubes scattered over the entire beach. These tubes originated from a sandy substrate in the nearshore marine zone. Five small Red Rock Crab (Cancer productus) carapaces were identified ranging from 2.5 to 3 cm in length. A large leg from the same species of crab was also found. These crabs would have been consumed by marine shorebirds and deposited along the shore by wave action or birds.

Two species of seagull, the Herring gull (Larus argentatu) and Glaucus-winged gull (Larus glaucescens), along with about 17 seals were actively feeding, possibly on herring, in the nearshore marine zone about 50 meters from the beach. The seagulls were feeding in a tight circle about 3 meters in diameter, diving into the water and returning to the surface with tiny silver fish, possibly herring. The seals were exhibiting the same behaviour suggesting a large school offshore. It is unlikely that salmon would be present in Witty’s Lagoon because they would not be able to navigate the waterfall.

Section 4. Land Use:
4.0 Overview:
Historically, the park area was used by the Ka-Kyaakan band of the Northern Straits Salish people. Evidence of native culture in Witty’s Lagoon Park includes three shell middens and two fortified sites (CRD Internet). In 1850, the Hudson Bay Company purchased the land from Pedder Bay to Albert Head, and in 1851, the Witty’s Lagoon section was purchased privately; the native band continued to live on the beach for another century. The land was taken over by the Witty family in 1867 and used as farm land. Evidence of the European agricultural history includes apple trees, blackberries, a concrete irrigation weir and decaying fence posts. The authority in charge of the park, the Capital Regional District (CRD) has a mandate to protect and interpret archaeological resources; manage archaeological sites in cooperation with the Archaeology Branch of the Ministry of Small Business, Tourism and Culture, and maintain an inventory of historically significant sites (ibid.). This mandate is in response to the requirements of the Heritage Conservation Act, which was passed in 1994 (ibid.). The area comprising Witty’s Lagoon Regional Park was acquired by the CRD in 1969 and receives an average of 80,000 visitors per year (ibid.). The park is located south of Tower Point, on the southern end of Vancouver Island, within the Bilston Creek watershed. The CRD provides a parking lot, trails, nature house, and pit toilets; the park is used for a variety of purposes, including hiking, bird-watching, beachcombing, horse riding on designated trails, swimming, and picnicking. These activities are compatible with a multiple use model, and result in a high level of use, particularly during the summer months.

Land use within the Bilston Creek watershed is industrial, residential and agricultural. The headwaters of the creek are located along Humpback Road, and before the creek enters the park, it flows beside the highway, past a Lilydale Poultry Plant and through residential areas. The creek has marginal value for a cutthroat trout fishery, due in part to the high biological oxygen demand of the effluent from the Lilydale Poultry Plant (Bilston Watershed Habitat Protection Association, 1994).

The survey method used was both quantitative and qualitative: biota, geomorphology and land use were observed in the field; discussions were held with members of the Royal Roads University faculty; maps and air photos were used to aid interpretation of field observations, and coastal zone management issues were researched.

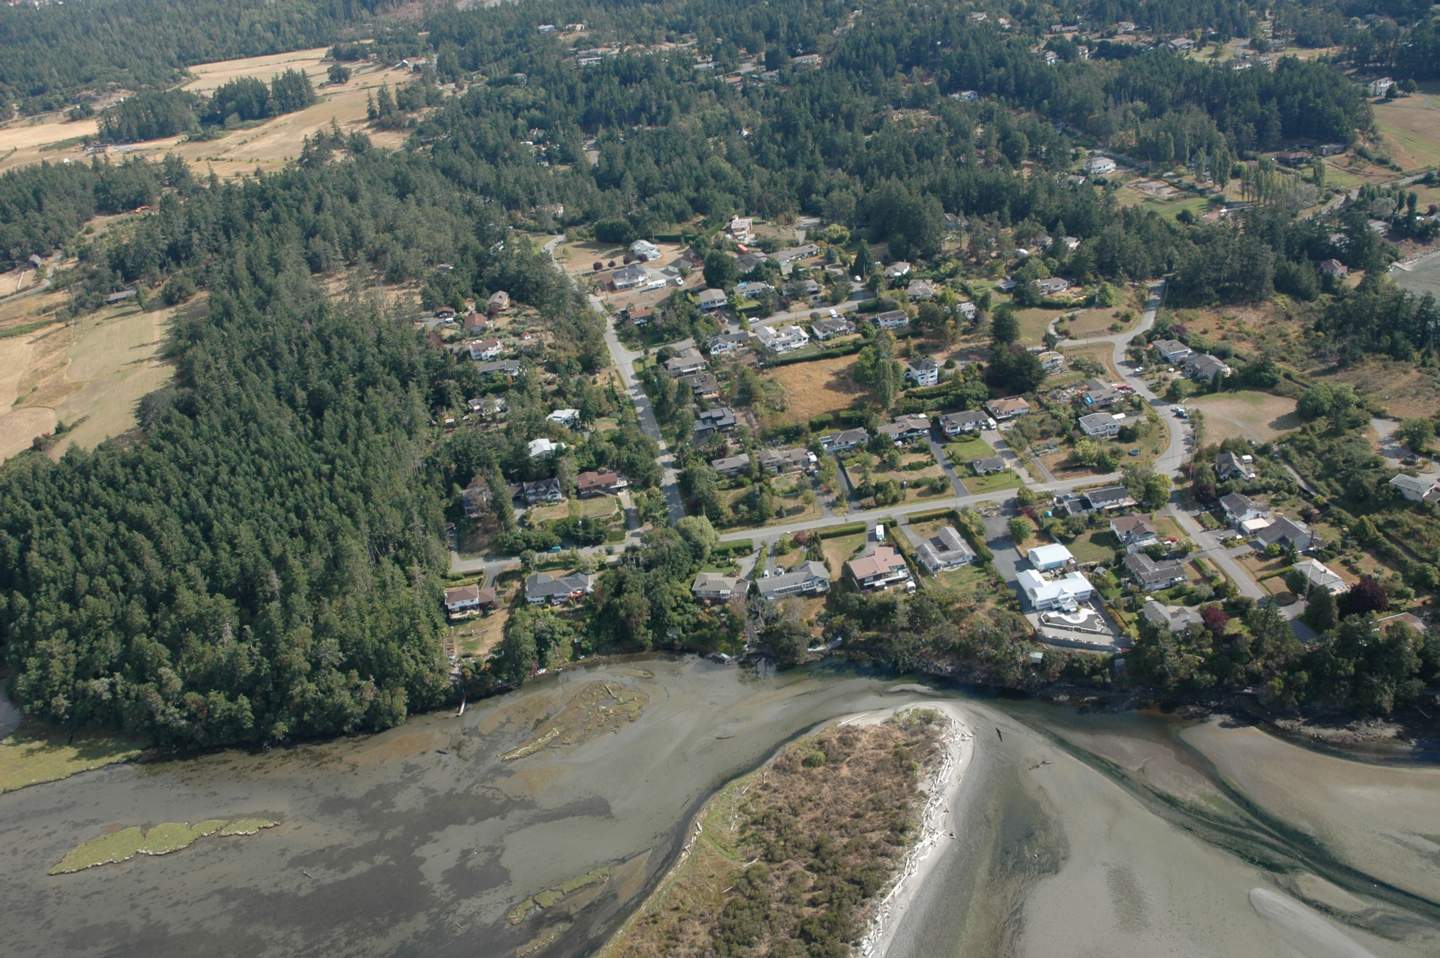
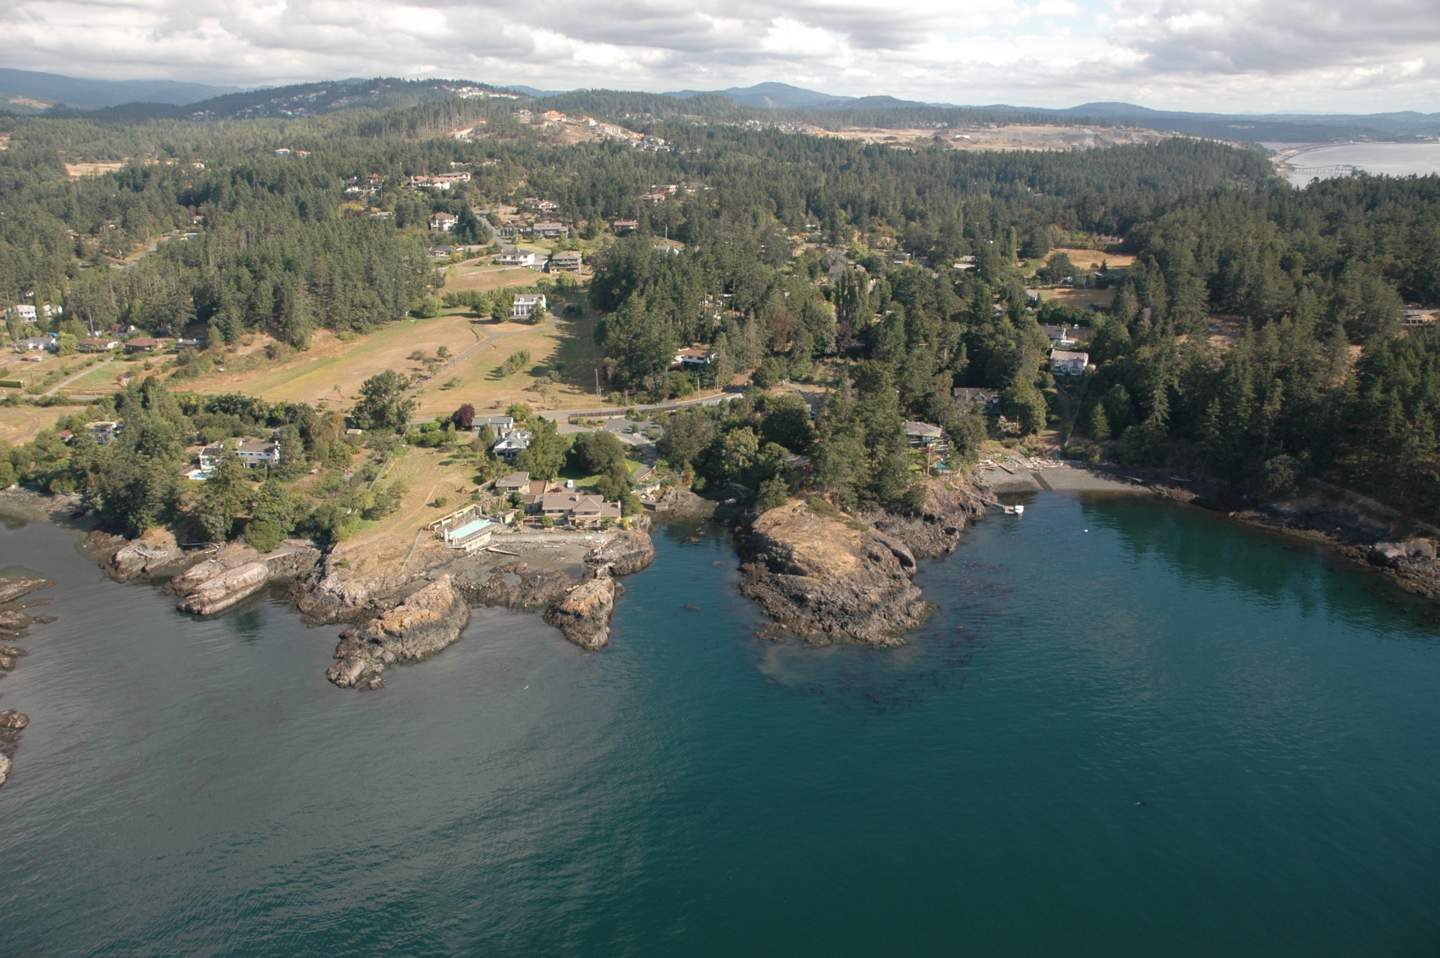
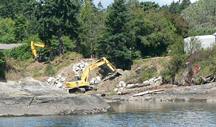
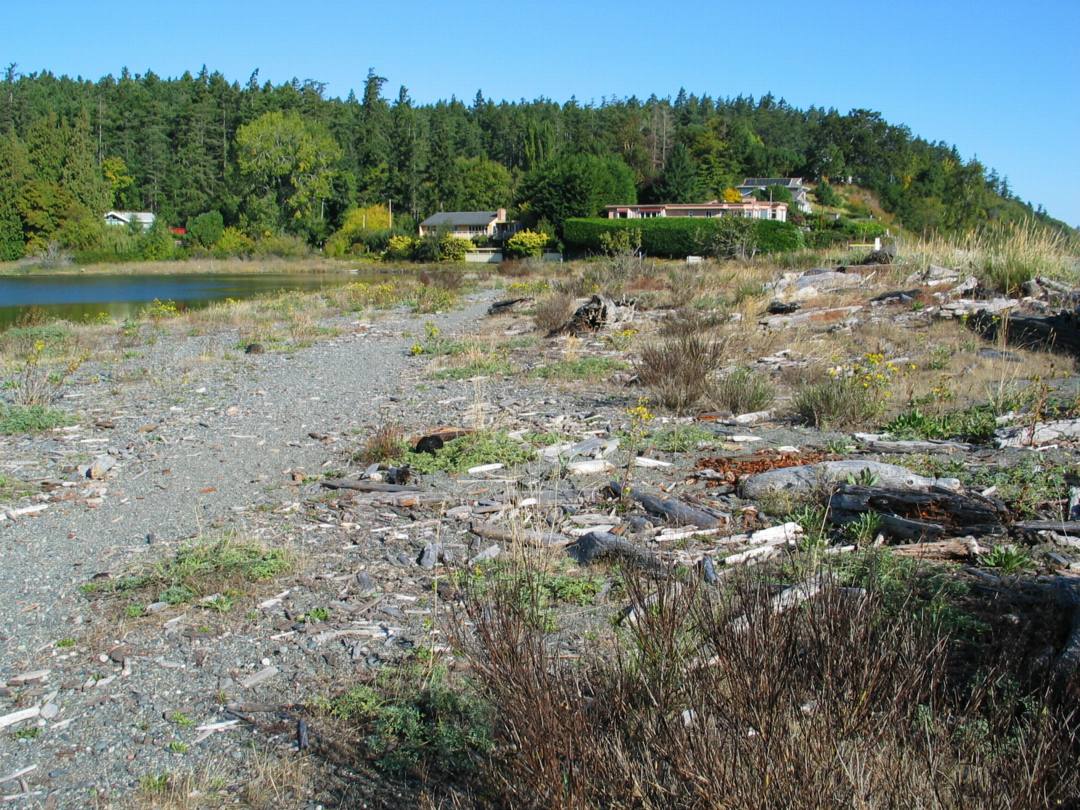
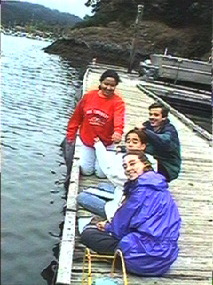
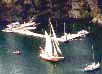
Coastal development near the park is limited to two residential areas that are 30 to 40 years old; one area is on the south side of Tower Point east of the lagoon, and the other area is southwest of the lagoon. The houses on Tower Point have a greater aesthetic impact on the park, as they line the lagoon outflow channel; the other houses are hidden from view by the forest. Most residents on Tower Point have left the shoreline in a relatively natural state; however, one residential lot has a cement brick retaining wall and highly cultivated lawn. There are two small private docks in the outflow channel; on one dock rested a canoe.

There are no artificial erosion devices in the park; Tower Point and the naturally formed spit protect the lagoon from the effects of storms.

Previous developments have impacted the park. Species, such as Scotch Broom and Himalayan Blackberries, are abundant in many areas of the park, and have irrevocably altered the ecosystems. The apple orchard affects a much smaller area, but along with the cement weir and fence posts, is still an important factor. The middens left by native people have likely changed the soil quality as the large quantities of shell material do not support plant life.

4.1 Description of Potential Values, Issues and Conflicts:
Witty’s Lagoon Regional Park is classified by the CRD as a nature appreciation park versus a recreation park, wilderness park reserve, or park corridor. The park features an active Nature Information Centre to aid in achieving this purpose. The value most strongly enforced by the CRD is therefore that of nature, rather than the historical and archaeological values. This contributes to potential land use conflict between park managers and first nations people who would like to have their history celebrated. There is also potential conflict between managers and those who use the area primarily as a recreation site. For example, there is no lifeguard at the beach, even though the beach is a popular swimming place. The CRD could also experience conflict with those who have little respect for nature, and disobey rules regarding littering and domestic animal control.

Development outside the park affects the water quality of Bilston Creek, and therefore has an impact on the management strategy of the CRD. Bilston Creek runs through residential areas where houses are dependent on septic tanks rather than municipal sewage. It also runs through agricultural areas and past Lilydale Poultry Plant; these factors all increase the nutrient loading of the water and change its properties within the park. Managers must decide how to cope with the enriched water – whether to leave it or attempt to restore it to natural levels. Agricultural run off and septic tanks will also affect the ground water, which drains into the park. Any pesticides applied to crops will be able to enter the park, and nutrient rich water entering the lagoon will promote eutrophication.

The CRD is responsible for allocating funds to the 19 regional parks; therefore, difficulties may arise between individual municipalities who feel that the parks within their boundaries deserve a greater portion of funds. The CRD must maintain trails and facilities with an efficient and effective distribution of funds; this distribution is not simple to define. Trail widening is evident, and is considered to be a problem in need of CRD-led remediation. Conflict may well arise when this issue is tabled by the CRD.

The final potential conflict is between park users and local residences. This is a common problem when residential areas border parks, especially those with high recreational value such as the beach at Witty’s Lagoon. The establishment of the park in 1969 occurred after the construction of nearby residences. Residents may be disturbed by park visitors who are loud late at night, or who behave inappropriately. Park visitors, on the other hand, may not be impressed by the intrusion of houses in a natural area.

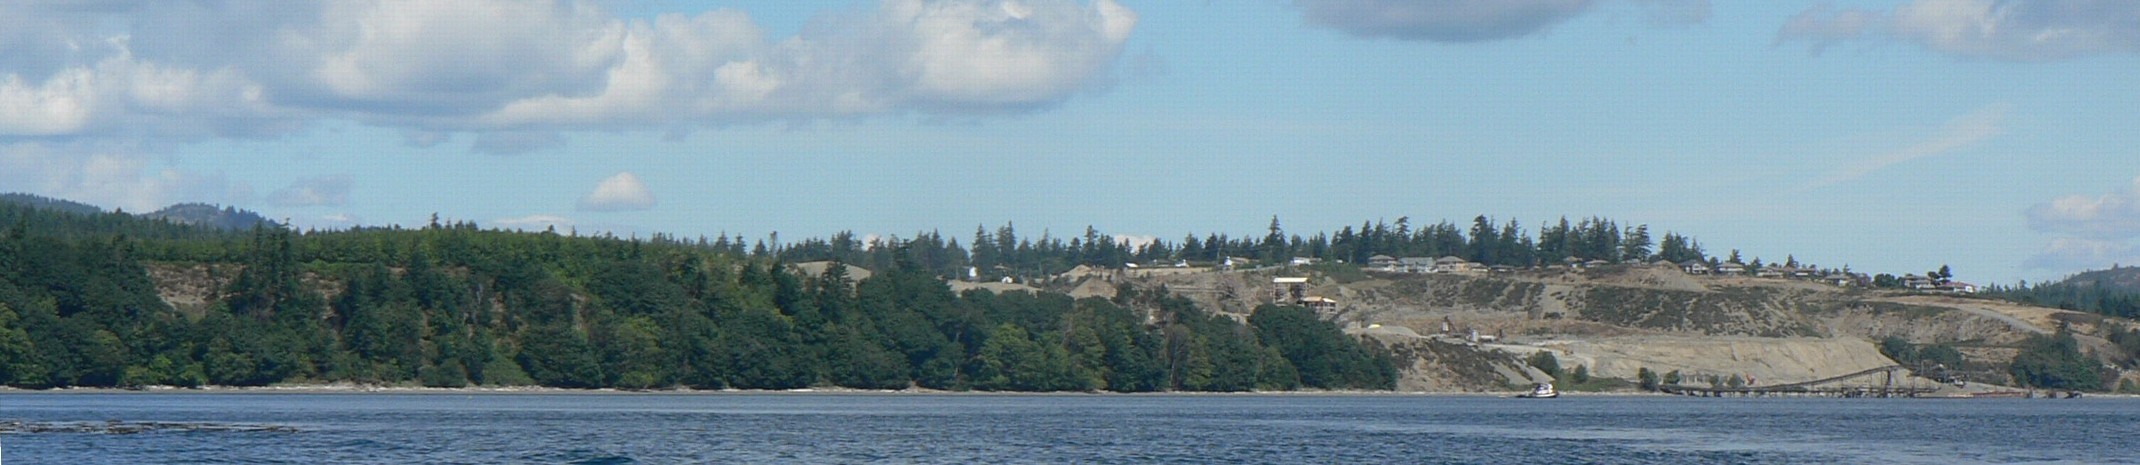
An upcoming issue is that of the proposed development at the Construction Aggregate gravel pits. Over the next 20 years, an estimated 5000 houses are scheduled to be built in the area (Robert Gale, personal communication). This will no doubt increase park usage and test its carrying capacity. This could have a negative effect on the biodiversity of the park and the health of the ecosystems.

4.2 Governance:
Witty’s Lagoon Regional Park covers an area of 56 hectares and is administered by the CRD as one of 19 regional parks, covering some 9000 hectares. It consists of a range of biophysical units, making governance a complex issue and long term planning crucial. The CRD was organized in 1966, and in 1993 was expanded to include 12 municipalities and 4 electoral (unincorporated) areas. The CRD is governed by a Board of Directors who represent the various member organizations and whose meetings are open to the public. The public has four ways of bringing an issue to the board:

1. Getting an item on the board agenda which involves presenting the item to one of the representatives to the Board from your local government;
2. Making a presentation to a CRD committee;
3. Speaking directly to the CRD board of directors; and,
4. CRD board committees and commissions.

As such, the public can be involved in the planning of the park and concerns can be heard. The CRD is responsible for trail maintenance and development, maintenance of other facilities, staffing the Nature Information Centre, and providing proper signs. Any concerns regarding issues such as the need for a lifeguard, or the effects of future housing developments should be addressed the CRD.

The CRD has realized the importance of the regional parks system, both ecologically and in terms of the human value. The Official Regional Parks Plan (ORPP) guides the actions of the CRD, and is currently being updated. The public has an opportunity to participate in updating the plan by participating in a Public Advisory Group (PAG) The goal of the PAG is “to bring together a diverse group of people from throughout the CRD, and who represent a broad range of interests, to provide advice to the CRD Parks Committee about the future of CRD Parks.”

The District of Metchosin plays a greater role in the governance of Witty’s Lagoon than other CRD members, since it borders the south end of the park, and Bilston Creek and many of its tributaries run through Metchosin before entering the park. Since this is the area in which Bilston Creek becomes contaminated, Metchosin must take responsibility for the condition of the creek entering the park. Bilston Creek runs through residential areas in Metchosin where houses are dependent on septic tanks rather than municipal sewage, as well as agricultural areas, and the Lilydale Poultry Plant.

Section 5. Summary:
Witty’s Lagoon Regional Park and the surrounding areas are important multi-use landscapes in the Capital Regional District. The park maintains an ecologically important green space and provides educational and recreational uses to the public.

Witty’s Lagoon Regional Park consists of several biophysical units, which enhances its ecological interest and value, in terms of maintaining biodiversity of the region. The upper reaches of the park are primarily Douglas fir, with a sword fern understory. The only fauna found in this area were banana slugs, but evidence of other wildlife included habitat trees. Proceeding towards the lagoon, one comes across an area which has been cleared and is impacted by human development. This is the site of the farmstead which was active in the late 19th century and early 20th century. Visible impacts include the introduction of exotic species such as Scotch Broom, Himalayan Blackberries and apple trees. The spit is also covered with Scotch Broom, to such a extent that eradication is next to impossible. The spit has been formed by deposition in the form of longshore drift. The lagoon area is a refuge for water fowl, including ducks, cormorants and gulls. This area is becoming more significant, especially for migratory birds, as other habitat is destroyed by urban development.

One of the main attractions of the park is Sitting Lady Falls which is near the end of Bilston Creek. The three main areas of the lagoon are the freshwater, transition and salt water zones. Each is shaped by different geomorphological processes: the waterfall cascades down a bed of pillow basalt, which forms three sides of the lagoon. The transition zone lies between the landward side of the spit and the waterfall. The main forces in this area are the river current and tidal action. The salt water zone lies between the ocean front and the transition zone. It is shaped by wave action and ocean currents. The beach will continue to be formed by wave action and wind.

Agricultural uses continue to input nutrients into Bilston Creek; the discoloration of the lagoon could be due to an algal bloom, resulting from the nutrient loading. Testing of the lagoon for the cause of the discoloration is recommended, so that the public can be made aware of the cause and any associated risks.

Socio-economic considerations are unlikely to undergo a significant shift, as land use issues have been fairly static for the past 20 years. However, proposed developments in the surrounding areas will impact the park if they proceed. The CRD has recognized the importance of public input to decision making and the Public Advisory Group has been established as a forum for residents to voice any concerns.

In addition, the public could be more informed regarding the historical and archeological significance of Witty’s Lagoon.

Section 6. References:
The Naturalist’s Guide to the Victoria Region. 1986. Cd. Jim Weston’s & David Stirline. Victoria Natural History Society.

Bilston Watershed Habitat Protection Association. A summary of field investigations, Victoria, BC, November, 1994.

CRD Internet Site: Information about CRD Areas URL: http://www.crd.bc.ca

Capital Regional District Parks, Witty’s Laggon Region Park Management Plan. Nov. 1994. Victoria, BC.

Waterose et. al.
Judith R. Burke
and: S. Ivanko, R. Luco, J. Walker, S. Wilmot

Sector 7: Taylor Beach, Witty’s Lagoon and Albert Head

Aerial views courtesy of the CRD NATURAL AREAS ATLAS

11..Witty’s lagoon/estuary and 10. Beach spitwittys

Witty’s beach is an accretional beach with materials supplied from long shore drift from the cliffs to the south. Behind the beach is a large tidal lagoon, and estuary fed by Bilston Creek.


Report on Witty’s lagoon (includes Ecology, geology etc. Waterose et al.

Link to the Witty’s lagoon Waterose et.al report


Link to the Anthropogenic Effects on this area


Link to The Wittys Lagoon Estuary and Beach Lab

The following booklet was written in the 1970’s based on the report done by Dr. Wolf Bauer.

A panorama view from the inside of the spit on Witty’s lagoon

A panorama view of the narrow channel for tidal exchange at the end of Witty’s Spit.

4.. Haystock Islands

Haystock Islands show some evidence of human occupation by First Nations in the past.


4.5,6,7.. Tower Point and Duke Road Waterfront
South of Albert Head


  • ** “You can also see excellent exposures of pillow lavas at Tower Point. On the Point and in the sea cliffs of nearby islands, the characteristic feature of the pillow basalts are well displayed in clean outcrops above the high tide line. These dark green, fine-grained rocks commonly contain amygdules filled with quartz and calcite, which appear as white spots up to 1cm in diameter. Several vertical, green vesicular dykes, up to 1 m. wide, trend across the point, and a minor east dipping fault is exposed on the western side of the point. Several outcrops display piles of basalt pillows with flattened bases and shapes that indicate they were squeezed together while the lava was still hot and plastic. You cans see conspicuous light grey to almost white boulders of granodorite, obviously (glacial) erratics, lying on the surface of the pillow basalts.”…..
  • “According to Nick Massey of the BC Geological Survey, the Metchosin Igneous Complex developed as an oceanic island, not unlike Iceland, about 54 million years ago. The pillow basalts exposed here as well as those at the Sooke Potholes… are only part of the complex….Many of the pillows seen in this area contain abundant, round white amygdules, which are commonly arranged in layers close to the margins of the pillows. These amygdules were originally vesicles that have been filled by crystals of calcite and other minerals. Vesicles form when gas, dissolved in molten lava separates from the liquid, causing it to froth. If the pressure of the weight of the overlying water is sufficiently great, the gas does not separate and no vesicles form. Thus there is a rough correlation between the depth below sea level at which the lava erupted and the vesicularity of the lava; with increasing depth, the degree of vesicularity decreases. From this relationship, we can conclude that the pillow basalts of the Metchosin Igneous Complex erupted in moderately deep to shallow water, but not as deep as the present Pacific Ocean Spreading Ridges.”
    2005, Yorath, Chris, The Geology of Southern Vancouver Island, page 114, Harbour Publishing.


5.South Side of Albert Head


4,. Albert Head and 2 and 3 North Lagoon and 1.Beach


To the north of Albert Head Beach and outside of the boundaries of Metchosin District lies the gravel pit which is now in the stages of being close down, to be replaced by a large development .


Anthropogenic habitat modification from Witty’s lagoon to the south side of Albert Head.

Acknowledgements:

Anthropogenic Impacts Albert head lagoon and shoreline

Helicopter aerial views courtesy of GEOBC

The CoastaMetchosin website has been created to represent the contiguous ecosystems of the Race Rocks Ecological Reserve/Marine Protected Area and for the use of the Green Blue Spaces sub committee of the Metchosin Environmental Advisory Select Committee (MEASC). Copyright: G.Fletcher 2013 (garryf ( use at) gmail.com)


Gooch Creek and Associated Ecosystems: Issues and Solutions

Ed Note: all mentioning of the invasive species Phragmites australis should now be updated to indicate this species has been identified by DNA sampling as the Native Species Phragmites australis, subspecies americanus.

By Moralea Milne, Student # 9913797,  ER 390, April 12, 2004

Abstract:  Gooch Creek and associated ecosystems provides habitat for two provincially blue-listed species: coastal cutthroat trout (Oncorhynchus clarki clarki) and red-legged frog (Rana aurora) as well as three spine stickleback (Gasterosteus aculeatus). Gooch Creek and associated ecosystems were mapped using Global Positioning Systems technology. Studies using Streamkeepers, Wetlandkeepers, Urban Salmon Habitat Program and Proper Functioning Condition to assess Gooch Creek have found the cumulative effects of land conversion, land use, livestock usage, invasive species encroachment and roads practices have negatively effected the aquatic health this system. Water quality sampling was conducted every second week at six locations for dissolved oxygen, water temperature, total dissolved solids, pH and turbidity. Chemical analysis of soil and water was also Continue reading

The Plankton of Pedder Bay Lab

Triceratops

BACKGROUND: Microscopic plankton can be can be collected in a way that allows us to determine densities of the organisms, and therefore compare different pelagic environments. We have already seen how plankton populations can vary from part of the ocean to another. In order to quantify plankton, the following method is suggested. You are urged to come up with your own research problem concerning plankton populations and then proceed to use the following techniques to investigate. Although this lab refers to Pedder Bay on Vancouver Island,, It could be modified to suit any location.PROCEDURE:In order to determine densities of organisms, we first have to know the volume of the water from which the sample is taken.
1. Calibrating the log:

    • You will use a plankton net with a small propellor driven counting log to measure distance travelled in the water that is sampled. To calibrate the log, measure off a distance on the docks, read the dial at the beginning of the trial, drag it through the water the length of the measured section, and the difference in the reading at the end of your tow will be the length of your cylinder of water.
    • Now calculate how many counts on the dial there are per meter.
    • Divide the number of counts per meter into the number of counts through the distance you drag the net for your sample. This gives you a number of meters in length for the sample cylinder.
    • Measure the diameter of the net opening and now calculate the volume of sample taken from the open ocean. The formula for volume of a cylinder is V=(pi X radius squared) X h(meters)

3. What is in The sample?

      • Note the total volume of the sample traken. Then remove a representative subsample of 1 ml.
      • Place the 1ml sample in a slide with a measured viewing chamber. Count numbers of individual species in representative quadrats. Obtain the average, and multiply this number by the total number of quadrats available.

4. Density determination.

      • .Now calculate the density of the individual species in the sample . i.e. number per cubic cm. then per cubic meter.

5. Option :

    • Calculate the number for a larger area e.g. Pedder Bay ! Hint treat it as a segment of a cone for volume determinations, use a chart to determine the measurements of the bay..

Pedder Bay frequently has booms of Mesodinium rubrum. This organism turns the bay a deep wine color . It is not a poisonous red tide , but we have noticed that when it is pumped up into seawater tanks, it will easily smother some of the filter feeders such as sponges. Blooms often coincide with nutrient loading followed by a period of sunny weather.


The Fouling System– Pedder Bay-Archive

The fiollowing set of lab reports were done as an exercise by the marine environmental systems class in September 1997

ENVIRONMENTAL SYSTEM CLASS ASSIGNMENT : SEPTEMBER 1997

For the first assignment of the year, the first year environmental systems classes were given the task of working in groups to examine different one meter sections of the dock skirt at Lester Pearson College. This was their first experience in using html as a word processing and presentation media, and the following presentations represents their first draft.

A COPY OF THE FIELD-LAB WORKSHEET:

THE “FOULING SYSTEM”

PEARSON COLLEGE DOCKS IN PEDDER BAY

ENVIRONMENTAL SYSTEMS FIRST YEAR FIELD LAB

INTRODUCTION:

You will be shown a section of the protective rubber skirt hanging from the Pearson College docks. On the bullrail of the dock you will find lettered sections of 1 meter. Growing on the rubber you will find a community of organisms which lives in this unique location . On this first introductory lab, we want you to use this set of organisms to gain a better understanding of the structure and function of ecosystems.

TOOLS YOU WILL USE:

Reference: Odum- ECOLOGY and Our Endangered Life Support System page 38-58)

Identification Manuals,

Adobe PageMill Software, Power MacIntosh Computer

OBJECTIVES:

After doing this lab you will be able to:

A) Model using Odum’s Symbols the material; cycles and energy flow of the Pedder Bay fouling system represented on your section of dock skirt. (Page 40-41 Odum- ECOLOGY and Our Endangered Life Support System)

B) Define the boundary of your system.

C) Identify the Structural components of the system:

1) Biotic:

Horizontal distribution aspects- regular, clumped, random, etc.

Vertical Distribution of organisms- stratified- (depth),

Biodiversity of the organisms

2) Abiotic:

Temperature, light-Intensity and Quality, Nutrients, Wave Action, tidal height, Salinity, etc.

D) Identify the Functional Components of the system:

1) Energy Flows- Producers, Consumers, Decomposers, Trophic Levels

2) Material Cycles: ( Biogeochemical Cycles) -Nitrogen, Phosphorous, Carbon, etc.

3) Succession – Temporal and Spatial.

E) Prepare a web-ready page representing the process and findings of this study.

F) Discuss the ways that humans might have an impact on this system.

G) Quantify the populations of the community , (using density and frequency measures)

PROCEDURE:

1. You will work in four groups for this field lab. Special effort should be made to include all members of the group. Decide on a recorder for the group. The end product will be one electronic lab report for each group, made up of the contributions of all.

2. Use the references available and discussion with the teacher to establish a name for the major players in the system.

3. Examine the section of dock skirt assigned to your group. Describe the populations qualitatively and quantitatively .

4. You will be supplied with some tools to measure some of the abiotic factors in the area, Record the change of at least one of those factors over some predetermined unit of time. (a temporal aspect)

5. Produce a full page diagram model of the system being studied using the appropriate Odum symbols. Use different colors to represent energy flow and material cycles.

6. Prepare a web-ready document on the lab, link in photographs done with the video camera. Indicate to the teacher when you have decided which shots you want.

7. Open a glossary file ( Create it in the program EXCEL) on the computers to record new words encountered in this lab. Where you can translate into your own language, make that addition in a column.

OPEN ENDED SUGGESTIONS:

You may wish to work on a few more challenging ideas once you have understood the basics. The following could be done individually or by the group.

1. Is what you see happening here the same 24 hours a day? How can this be included in your model?

2. Can you devise a method to quantify wave action? How significant is it as an abiotic factor?

3. How fast does recolonization or succession take place here in the bay, and what steps does it go through in the process. Could a small scale experiment be set up to monitor this?

4. What is the diversity index of the organisms here ( use Simpson’s Diversity Index)

5. Further work will be done on the plankton of Pedder Bay later on. Is there anything you could do at this point to quantify these important organisms? Is the plankton composition constant from day to day (temporal aspects).

6. Prepare a “Case Study” of one of the organisms in this system. Life cycles- growth rates etc.

7. Design a pyramid of biomass for the system. (This would entail wet or dry weights of the organisms of each trophic level.)

September 1997, Environmental Systems

Garry .Fletcher:. Lester B. Pearson College

STUDENT PAGES

Sophie Desoulieres, Fiona Talbot-Strong, Tamas Vonyo.

Tubeworms Anonymous

The rain was dripping on us as we embarked on our most difficult task of staring at stuff on a rubber skirt attached to the dock on our beautiful campus. Being generally good-natured, we pressed on regardless.

Purpose of the field lab: To observe the unique biodiversity that can be found on a rubber skirt.

Procedure: We looked at the plant and animal life present, learning their names and functions within our system, and measured both the air and water temperatures within that system. We decided the boundaries of our system, i.e. 25 cm deep, one metre long, and one metre from the dock. This being said, we kept in mind that the surrounding area directly affects our system.

tube worms, pink sponge, yellow sponge, limpets, mussels, ulva, school of anchovies, jelly fish, obelia, phytoplankton. The amount of plankton was such that one could see 3.25 metres towards the ocean floor.

Producers: Ulva, phytoplankton, diatoms

Primary consumers: anchovies, limpets,

Secondary consumers: salmon, seagulls ( In general seagulls eat salmon, which makes them tertiary consumers too. )

Abiotic factors:
Temperature: 10.1 C ; Salinity: 27 ppt (parts per thousand)
The salinity rate of the water in Pedder Bay is lower than the one of the Pacific Ocean ( 36 ppt ) As Pedder Bay is in an estuary ( fresh and sea water ).Wave action: There were 5 waves ( about 30cm high ), when a boat passed. We noticed that there were less plankton when we made our measure with the Secchi disc.

===============================================

Forrest Pass , Eri Akamatsu, Kelly Bowen

On September 16, 1997, we went down onto the docks of Pedder Bay to study the marine ecosystem. We took note of the various species of creatures living on the rubber skirt surrounding the dock. We observed that there are many factors affecting the ecosystem, both biotic and abiotic.

Purpose of the Field Lab:

The purpose of the field lab was to formulate a model of the marine ecosystem on the rubber skirt around the college dock.

PROCEDURE:

To begin, we went to the docks and took note of the various creatures we saw on our rubber skirt. We also recorded the factors within our three cubic metre marine system.

Species List:
-Barnacles

-Mussels

-Ulva (Green Algae)

-Limpets

-Seaweeds

-Halochondria (Yellow Sponge)

-Red Filamentous Algae

-Obelia (Something Whitish)
-Isopods
-Little Fish
-Gulls
-Douglas Fir Needle
-Ocean Spray
-Leaves

-Boats (wake and oil residue)
-Guano (contains nitrogen and phosphates)

OBSERVATIONS:

During this lab, we observed the interaction of several marine species. In addition to observing organisms feeding on other organisms (ie: barnacles on plankton, harbour seals on herring or anchovies), we also observed organisms involved in symbiotic relationships. For example, we observed barnacles anchored to limpets. The relationship results in mutual benefit as (a) the barnacles are able to anchor themselves, alleviating problems that could result from “swimming free”, and (b) the barnacles help to discourage predators that could potentially prey on the limpets. There are several other biotic factors that affect the system, including “guano” produced by seagulls that, as it contains phosphates and nitrogen, helps to maintain the balance of nutrients within the system.

We also observed numerous abiotic factors that could , and in all likelihood do, affect the lives of the living organisms. These include the temperature of the water, a factor that helps to determine which organisms can survive in the system; the amount of sunlight to which the system is exposed, a factor which affects the plankton, algae, and seaweed populations; and the salinity of the seawater. Human activity also plays an important role in the system. The wake from boats, pollutants from human sources, and the number of fish caught by commercial fishing fleets and recreational anglers all affect the processes of the system.

It is unlikely that the processes within the system are constant. Seasonal disparities in sunlight, temperature, and animal and human population in and around the system indubitably affect the many of the qualities of the system. For example, a sudden rise in the seagull population could upset the delicate nutrient balance in the system. This sudden change, coupled with favourable amounts of sunlight and warm temperatures, would precipitate a large algae “bloom”. The rise in the seagull population could be a direct result of a drop in the seal population, thus eliminating competition between the two species over their common food source: fish. The decline in the seal population, in turn, could be the result of human economic factors: pollution from seaside industrial projects, or the massacre of seals resulting by fisherman angered by low salmon returns. Thus, abiotic factors that fluctuate throughout the year have a profound impact on the processes of the system and, by extension, on the organisms therein.

Visibility is an indicator of light penetration and is, therefore, an important quantifiable abiotic factor. One uses a Secchi dish to quantify visibility; on September 19, 1997, the Secchi dish was visible to a depth of 3.5 metres. However, in winter, this figure would increase because of the lack of plankton and algae in the frigid water. Human activity on the periphery of the systemwould also have an effect on the visibility; fertilizers carried in runoff from seaside farms could upset the nutrient balance of the system, perhaps creating an algae “bloom” (decreased visibility), while large falls of “acid rain” could adversely affect the pH level within the system, killing off the algae/plankton. The second scenario has occurred in parts of Ontario, creating lakes that are “crystal clear”.

The action of waves and tides have an effect on the system and its member organisms. Tides and waves “flush out” the system, thus helping to maintain the nutrient levels necessary for the survival of organisms within the system. Without tide and wave action, the water in the system would become stagnant. Nutrients, such as nitrogen, would accumulate in the stagnant water, fertilizing algae and other marine plants. While tide action is fairly easy to quantify, the quantification of wave action poses a challenge. One could determine the regularity of waves by counting the number of waves the pass a certain point in an hour (day, month, year) and divide by the number of minutes (hours, days, months) to derive an average. It could also be useful to determine the average height of waves passing a point, or the force with which these waves strike a dock. These would all aid in the quantification of wave action.

Forrest, Eri, Kelly

=============================================

Sara Pavan, Giovanni Rosso, Sebastian Ferrero:
For this lab we analysed the system contained in a section of the rubber skirt which protects our docks at Pedder Bay.

PURPOSE: To model the structure and function of the fouling system.


BIOTIC STRUCTURE:( Species List )

Polyorchis, Mussels,Isopod,Sea Squirt,Herring,Blue Heron,Cormorant,Harbour seal,Sea Gulls,Limpet

Materials: Thermometer, meter stick, and a spatula

Boundary: Our system included the “I” section of the dock skirt. The environment we considered was 1m deep and ran to the opposite side of the bay. We determined this to be our boundary because it would include factors which influence our small section of the rubber skirt such as mammals, birds and human factors.

Distribution aspects: The most prosperous life forms in our system were the mussels. After taking several measurments in different parts of the skirt we found out that the average density is of about 28 mussels per 25 centimeters squared. These results lead us to the conclusion that there are more or less 1800 shells in the “I” section. They were clumped towards the bottom of the skirt with very few of them near to the surface.

The sea squirts were clumped again around the bottom and were hidden between mussels. Numerous herring and even one polyorcas jellyfish migrated through our system.We sighted many birds entering our system to feed. The distribution was clumped- with a large concentration of lifeforms near the bottom of the rubber skirt, and far less organisms living at the top. Smaller organisms usually used the harder shell of the mussels as shelter and grew underneath them. The isopods in particular could usually find concealment under the cover of seaweed and mussels.

Abiotic: The temperature of the water was 12.5 degrees Celsius while the external temperature was 15 degrees. The light was brighter towards the top of the water. Nutrients in our system were provided by sun light , organic waste, and other materials brought in by the tide and other external factors. Because the tide changed often and fairly extremely, fewer organisms lived above the lowest sea level. It can be assumed that the ones which did were hardier and didn’t require an environment as stable as the ones living further under the water surface.

Docks by night: We also had a chance to observe the piece of skirt we observed during the night and we found out that several other species are apparent at that time. These were: shrimp (Two different species, which grasp on algea, shells and pieces of material also close to the sea level. We noticed that this behavior changes during windy evenings. In fact, they don’t come very near to the surface then, probably because until a certain depth the waves caused by the wind make it difficult for them to swim and grab materials.) ; clam worms (These invertebrates like to swim quite near to the surface especially around light sources); sculpins (These small fish like to search for food under the green algae beside the mussels) ; herring (These fish can also easily be seen during the day but at night they seem to be less active); small crabs (Some crabs appear near to the surface, but only small ones); fluorescent organisms (We never saw these organisms before. They look like small larvae and glow with a greenish light. They also like to swim near to light sources. The reddish brown striped shrimp seem to be slower but better protected by a larger thicker shell); seals (As almost all the organisms we listed above they are also far more daring at night when they come quite close to the docks.

Human impact: During the day the area around the docks is constantly crowded by boats which travel from the marina to the open sea and back. This causes both noise pollution and pollution of the water through oil, and waste products. Both these factors cause the animals to become more reticent during the day. Algae and shells don’t have the capability to react because they don’t have the ability to move but ” intelligent” animals such as seals, birds and fish often build a realtionship with human beings which permits them to find food easily. The best way in which people can operate in an environment is by respecting it and not trying to change the habits of the creatures that live inside it. Concluding we could say that as the number of human beings increases the density of animals who can’t move diminishes meanwhile the others can diminish , increase or remain the same as long as the new conditions are beneficial to them. Some animals might also be leaving during the day and coming back at night when the whole bay is more peaceful.

Density: We already have mentioned some of the density and distribution aspects of organisms living on the skirt before, but now we would like to spend a few words talking about animals which swim or fly around it : CORMORANTS ( These big black birds that have the habit of staying on the top branches, preferably if not covered by leaves, of high trees which grow near to the water usually gather in large groups until they haven’t covered the space they can use to sleep. In the bay they aren’t bigger of a dozen but at Race rocks, for example, the groups probably count hundreds of units.) ; SEALS ( These animals get near to the docks especially at night or during rainy days when the boat traffic is less intense and they aren’t normally more than two or three, but they don’t stay still in one place, instead they move around all over the place); KINGFISHERS ( These cute small birds are quite scared from human beings therefore they can normally be seen in the distance, mostly alone.); SEA GULLS ( Their density is usually higher on rainy days when they gather in flocks and search for food in the middle of the bay, otherwise they can be seen flying quite high in the sky but then their number isn’t very high); BIG FISH ( We suppose that during the day they stay in the middle of the bay in deep water and in repaired places away from noise and predators; we noticed although that the herring near to the bay sometimes jump scared out of the water at night, we therefore think that this is because both seals and big fish come near to the surface and the skirt; BALD EAGLES ( These huge birds seem to be quite rare around the bay but during these weeks we saw two or three circling high in the sky.)

Waves: As we mentioned before we noticed that waves have a great influence on the animal behavior around the skirt, but we think that it also interacts with animals at a certain depth because the bigger the waves are and the more intense the current is the more food and material you get carried into the bay, therefore fish become more active. The opposite end of the issue is that any pollution or negative influences will also enter the system faster.

It is quite hard to quantify waves although we could measure the highest point reached by one of them on a stick attaching it to the docks and then the lowest one when the water settles down; we could then approximate the number of waves by counting the ones which pass through a certain spot in a certain lap of time and describe then their shape . This procedure could probably give as a quite clear idea of what the sea was like on a certain day.

==============================================

Sarah McEachern, Karine Gaulin, Marieve Therriault

The Astounding Ecological System of Pedder Bay

It was the sixteenth day of September; a dark, rainy, dismal day when our brilliant Environmental Systems teacher got the ingenious idea of forcing us out into the elements. We plunged our hands into the ocean in search of life forms. We strained our eyes to catch sight of passing jelly fish and anchovies, we scraped our hands on barnacles and clams and we nearly fell into Pedder bay trying to count mussels.

================================================

Organisms of the Fouling System

by: Michal Mlcousek, Eva Mejnertz,

t was a rainy morning when we went to Pedder Bay. We were supposed to survey many organisms, which we haven’t seen before in our countries. It was a very nice introduction to a new subject – Environmental systems, which aim is an attempt to understand and realize everything as a system, depending on many factors.
Purpose of the field lab To gain a better understanding of the structure and function of the eco system, through a practical exercise.

Procedure: We lifted the rubber skirt protecting the docks, to observe the many organisms that were part of the system, depending on each other.

Structure biotic species list:

By Michal Mlcousek,and Eva Mejnertz

================================================

By: Merideth Shaw, Kuba Fast, Rocio Martinez, Monica Segura

Introduction

In our first environmental systems lab we went down to the college docks to examine the ecosystem of its protective rubber skirt. Pearson College is located on the northern shore of Pedder Bay, at the southern end of Vancouver Island. The bay is open to the southeast to Juan de Fuca Strait. It has a rock shoreline and is about 10 meters deep. It has tides of up to 3.3 metres, with the waves of up to 2.5 metres in extreme. The weather conditions around Pedder Bay are not at all severe – with usually wet and mild winters and cold and dry summers, with very low annual temperature amplitudes. Due to their southern exposure, the docks receive a fair amount of direct sunlight.

Purpose of this lab

The purpose of this lab is to model the structure and function of the Pearson College docks’ fouling system

Biotic structure

(i) Species list

also : – isopods,– small fish.

plantae:– ulva,– filamentous diatom.

By: Merideth Shaw, Kuba Fast, Rocio Martinez, Monica Segura


===============================================

By: Nick Lanham , Alex Gesheva, Andreina Torres Angarita


Purpose

To model the structure and function of the ecosystem of the life growing on the rubber skirt using a functional diagram with Odum symbols.


Biotic Structure

Species List:


 Mussels  Limpets
 Isopods  Barnacles
 Algae( Ulva)  Algae (Diatom)


Horizontal Distribution:

The organisms in our system were, for the most part, evenly distributed horizontally along our system. The exceptions were mussels, which were clumped in some areas, and very sparse in others, and the limpets, which were randomly scattered throughout.


Vertical Distribution:

There was a clearly defined vertical distribution in our system. The young Ulva algae grew near the top, as it needs more light and heat and as we moved deeper the mussels and older algae began to show up.

Abiotic Factors

We took 2 separate measurments of the temperature of the air and of the water in our system. The average air temp was 16.5. The water avarage was 10.5.

System Boundary:

By: Nick L. , Alexandra G., Andreina T.

Donna Gibbs: SPECIES LIST- From: William Head, Rosedale Rocks, Race Rocks

SPECIES LIST:

Compiled by:Donna Gibbs of the Vancouver Acquarium on dives made at Rosedale Rock, West Race Rocks and William Head in the summer of 1997. Groupings are made in Phylums or Divisions.

Dive 432 – Rosedale, Race Rocks – June 12, 1997


Epiphytic red algae (Smithora, Antithamnion, Ceramium, Polysiphonia)

Iridescent blade red algae (Iridea)

Encrusting coralline algae (Lithothamnion)

Branching coralline algae (Bossiella, Corallina, Calliarthron)

Bull kelp (Nereocystis)

Blade kelp (Costaria)

Blade kelp (Alaria)

Woody-stemmed kelp (Lessoniopsis, Eisenia, Pterygophora)

 Tar spot (Codium setchellii)
 Tan finger sponge (Isodictya quatsinoensis)

Orange-red encrusting sponge (Ophlitaspongia pennata)

Thick, dark red encrusting sponge (Plocamia karykina)

Boring sponge (Cliona celata)

Crumb-of-bread sponge (Halichondria, Haliclona spp.)

 Giant black feather-duster worm (Eudistylia vancouveri)

Sand-dwelling feather-duster worm (Sabella spp.)

Slime tubeworm (Myxicola infundibulum)

Multi-colour calcareous tubeworm (Serpula vermicularis)

Honeycomb tubeworm (Dodecaceria fewkesi)

Spaghetti or shell binder worm (Thelepus crispus)

 Plumose anemone (Metridium giganteum)

Red and green or Christmas tealia (Urticina crassicornis)

Crimson anemone (Cribrinopsis fernaldi)

Brooding or proliferating anemone (Epiactis prolifera)

Zoanthid (Epizoanthus scotinus)

Ostrich-plume hydroid (Aglaophenia struthionides)

Delicate-plumed hydroid (Plumularia spp.)

Orange hydroid (Garveia annulata)

Snail-fur hydroid (Hydractinia sp.)

Pink-mouthed solitary hydroid (Tubularia marina)

Thread-like, creeping network hydroid (Orthopyxis spp.)

Pink or violet branching hydrocoral (Stylaster venusta)

Encrusting hydrocoral (Allopora petrograpta)

Tiny star jellyfish (Phialidium gregarium)

  Other encrusting bryozoan (Schizoporella spp., Microporella spp., Eurystomella spp.)

Northern staghorn bryozoan (Heteropora pacifica)

 Gumboot chiton (Cryptochiton stelleri)

California mussel (Mytilus californianus)

Rock or purple-hinged scallop (Crassedoma giganteum)

White-cap limpet (Acmaea mitra)

Rough keyhole limpet (Diodora aspera)

Snail-dwelling slipper shell (Crepidula adunca)

Leafy hornmouth shell (Ceratostoma foliatum)

Blue top snail (Calliostoma ligatum)

Heath’s dorid (Geitodoris heathi)

Coloured dendronotid (Dendronotus diversicolor)

  Sea flea (Anisogammarus spp., Orchestia spp.)

Coon-stripe shrimp (Pandalus danae)

Candycane or candy-stripe shrimp (Lebbeus grandimanus)

Kincaid’s commensal shrimp (Heptacarpus kincaidi)

Giant or giant acorn barnacle (Balanus nubilis)

Oregon crab (Cancer oregonensis)

Masking or sharp-nose crab (Scyra acutifrons)

Hairy, flat lithode crab (Hapalogaster mertensii)

Scaled crab (Placetron wosnessenskii)

Orange hermit crab (Elassochirus gilli)

 Blood star (Henricia leviuscula)

Long-rayed or rainbow star (Orthasterias koehleri)

Six-rayed star (Leptasterias hexactis)

Sunflower star (Pycnopodia helianthoides)

Sun star (Solaster stimpsoni)

Serpent or daisy brittle star (Ophiopholis aculeata)

Giant red sea urchin (Strongylocentrotus franciscanus)

Purple sea urchin (Strongylocentrotus purpuratus)

Giant or California sea cucumber (Parastichopus californicus)

Creeping pedal or armored sea cucumber (Psolus chitonoides)

  Mosshead warbonnet (Chirolophis nugator) gorgeous – huge and red!

Copper rockfish (Sebastes caurinus)

Quillback rockfish (Sebastes maliger)

Black rockfish (Sebastes melanops)

Tiger rockfish (Sebastes nigrocinctus)

Kelp greenling (Hexagrammos decagrammus)

Ling cod (Ophiodon elongatus)

Scalyhead sculpin (Artedius harringtoni)

Red Irish lord (Hemilepidotus hemilepidotus)


Lobed compound tunicate (Cystodytes lobatus)

White-crust compound tunicate (Didemnum albidum)

Dive 433 – Rosedale, Race Rocks – June 13, 1997

 Epiphytic red algae (Smithora, Antithamnion, Ceramium, Polysiphonia)

Encrusting coralline algae (Lithothamnion)

Branching coralline algae (Bossiella, Corallina, Calliarthron)

 Woody-stemmed kelp (Lessoniopsis, Eisenia, Pterygophora)  Tar spot (Codium setchellii)
 Tennis ball sponge (Tetilla arb)

Smooth orange puff-ball sponge (Suberites montiniger)

 Red sand-dwelling tubeworm (not Sabella)  Coon-stripe shrimp (Pandalus danae)

Candycane or candy-stripe shrimp (Lebbeus grandimanus)

Kincaid’s commensal shrimp (Heptacarpus kincaidi)

Giant or giant acorn barnacle (Balanus nubilis)

Oregon crab (Cancer oregonensis)

Masking or sharp-nose crab (Scyra acutifrons)

Other encrusting bryozoan (Schizoporella spp., Microporella spp., Eurystomella

spp.)

 Lined chiton (Tonicella lineata)

Red chiton (Tonicella insignis)

Gumboot chiton (Cryptochiton stelleri)

Swimming or pink scallop (Chlamys sp.)

White-cap limpet (Acmaea mitra)

Rough keyhole limpet (Diodora aspera)

Leafy hornmouth shell (Ceratostoma foliatum)

Dire whelk (Searlesia dira)

Dwarf hairy triton (Trichotropsis cancellata)

Blue top snail (Calliostoma ligatum)

Cockerel’s dorid (Laila cockerelli)

Plumose anemone (Metridium giganteum)

Red and green or Christmas tealia (Urticina crassicornis)

Crimson anemone (Cribrinopsis fernaldi)

Brooding or proliferating anemone (Epiactis prolifera)

Zoanthid (Epizoanthus scotinus)

Sea fir (Abietinaria spp., Thuiaria spp., Sertularia spp.)

Ostrich-plume hydroid (Aglaophenia struthionides)

Delicate-plumed hydroid (Plumularia spp.)

Orange hydroid (Garveia annulata)

Pink or violet branching hydrocoral (Stylaster venusta)

 Blood star (Henricia leviuscula)

Long-rayed or rainbow star (Orthasterias koehleri)

Six-rayed star (Leptasterias hexactis)

Sunflower star (Pycnopodia helianthoides)

Sun star (Solaster stimpsoni)

Giant red sea urchin (Strongylocentrotus franciscanus)

Purple sea urchin (Strongylocentrotus purpuratus)

Giant or California sea cucumber (Parastichopus californicus)

Black sea cucumber (Cucumaria lubrica)

 Copper rockfish (Sebastes caurinus)

Quillback rockfish (Sebastes maliger)

Kelp greenling (Hexagrammos decagrammus)

Ling cod (Ophiodon elongatus)

Scalyhead sculpin (Artedius harringtoni)

Cabezon (Scorpaenicthys marmoratus)

Lobed compound tunicate (Cystodytes lobatus)

White-crust compound tunicate (Didemnum albidum)

Dive 434 – West Race Rocks – June 13, 1997


Woody-stemmed kelp (Lessoniopsis, Eisenia, Pterygophora)

 Surf grass (Phyllospadix)
 Tan finger sponge (Isodictya quatsinoensis)

Boring sponge (Cliona celata)

Pecten sponge (Mycale adhaerens)

Sulphur sponge (Myxilla lacunosa)

Smooth orange puff-ball sponge (Suberites montiniger)

 Orange ribbon worm (Tubulanus polymorphus)

Giant black feather-duster worm (Eudistylia vancouveri)

Sand-dwelling feather-duster worm (Sabella spp.)

Honeycomb tubeworm (Dodecaceria fewkesi)

Spaghetti or shell binder worm (Thelepus crispus)

 
 Kelp-encrusting bryozoan (Membranipora membranacea)

Other encrusting bryozoan (Schizoporella spp., Microporella spp., Eurystomella

spp.)

Spiral or spiral-tuft bryozoan (Bugula californica)

Fluted bryozoan (Hippodiplosia insculpta)

Northern staghorn bryozoan (Heteropora pacifica)

 Gumboot chiton (Cryptochiton stelleri)

California mussel (Mytilus californianus)

Sea bottle clam (Mytilimeria nuttallii)

Rough keyhole limpet (Diodora aspera)

Northern or pinto abalone (Haliotis kamtschatkana) 1 – 4″

Dwarf lurid triton (Ocenebra lurida)

Monterey sea lemon (Archidoris montereyensis)

White dorid (Archidoris odhneri)

Opalescent aeolid (Hermissenda crassicornis)

Three-lined aeolid (Flabellina trilineata)

Coloured dendronotid (Dendronotus diversicolor)

Giant Pacific octopus (Octopus dofleini)

White-spotted tealia (Urticina lofotensis)

Crimson anemone (Cribrinopsis fernaldi)

Brooding or proliferating anemone (Epiactis prolifera)

Zoanthid (Epizoanthus scotinus)

Soft coral (Gersemia rubiformis)

Sea fir (Abietinaria spp., Thuiaria spp., Sertularia spp.)

Ostrich-plume hydroid (Aglaophenia struthionides)

Delicate-plumed hydroid (Plumularia spp.)

Orange hydroid (Garveia annulata)

Snail-fur hydroid (Hydractinia sp.)

Pink-mouthed solitary hydroid (Tubularia marina)

Pink or violet branching hydrocoral (Stylaster venusta)

  Leather star (Dermasterias imbricata)

Blood star (Henricia leviuscula)

Long-rayed or rainbow star (Orthasterias koehleri)

Velcro or fish-eating star (Stylasterias forreri)

Six-rayed star (Leptasterias hexactis)

Sunflower star (Pycnopodia helianthoides)

Sun star (Solaster stimpsoni)

Morning sun star (Solaster dawsoni)

 Kelp greenling (Hexagrammos decagrammus)

Ling cod (Ophiodon elongatus)

Scalyhead sculpin (Artedius harringtoni)

Cabezon (Scorpaenicthys marmoratus)

Red Irish lord (Hemilepidotus hemilepidotus)

 Light-bulb tunicate (Clavelina huntsmani)

Stalked, dwarf light-bulb tunicate (Pycnoclavella stanleyi)

Stalked compound tunicate (Distaplia smithi)

Dive 431 – William Head, Vancouver Island – June 12, 1997

Epiphytic red algae (Smithora, Antithamnion, Ceramium, Polysiphonia)

Iridescent blade red algae (Iridea)

Encrusting coralline algae (Lithothamnion)

Branching coralline algae (Bossiella, Corallina, Calliarthron)


Bull kelp (Nereocystis)

Woody-stemmed kelp (Lessoniopsis, Eisenia, Pterygophora)

 Orange-red encrusting sponge (Ophlitaspongia pennata)

Thick, dark red encrusting sponge (Plocamia karykina)

Boring sponge (Cliona celata)

Hermit crab sponge (Suberites suberea) with Pagurus stevensae

 Agassiz’s peanut worm (Phascolosoma agassizii)

Scale worm (Halosydna brevisetosa, Harmothoe spp.)

Slime tubeworm (Myxicola infundibulum)

Multi-colour calcareous tubeworm (Serpula vermicularis)

Cement tubeworm (Sabellaria cementarium)

Spaghetti or shell binder worm (Thelepus crispus)

Plumose anemone (Metridium giganteum)

Red and green or Christmas tealia (Urticina crassicornis)

Fish-eating tealia (Urticina piscivora)

Brooding or proliferating anemone (Epiactis sp.)

Orange cup coral (Balanophyllia elegans)

Sea fir (Abietinaria spp., Thuiaria spp., Sertularia spp.)

Silver-tip hydroid (Abietinaria greeni)

Pink or violet branching hydrocoral (Stylaster venusta)

Encrusting hydrocoral (Allopora petrograpta)

Water jellyfish (Aequorea victoria)

Tiny star jellyfish (Phialidium gregarium)

Other encrusting bryozoan (Schizoporella spp., Microporella spp., Eurystomella

spp.)

Northern staghorn bryozoan (Heteropora pacifica)

Southern staghorn bryozoan (Diaperoecia californica)


 Oval brachiopod or lamp shell (Laqueus californicus) ?
 Lined chiton (Tonicella lineata)

Red chiton (Tonicella insignis)

Gumboot chiton (Cryptochiton stelleri)

Swimming or pink scallop (Chlamys sp.)

Rock or purple-hinged scallop (Crassedoma giganteum)

Jingle shell (Pododesmus cepio)

Northwest ugly clam (Entodesma saxicola)

Hooded puncturella (Puncturella cucullata)

Northern or pinto abalone (Haliotis kamtschatkana)

Leafy hornmouth shell (Ceratostoma foliatum)

Dwarf lurid triton (Ocenebra lurida)

Oregon or giant hairy triton (Fusitriton oregonensis)

Dwarf hairy triton (Trichotropsis cancellata)

Blue top snail (Calliostoma ligatum)

Ringed top snail (Calliostoma annulatum)

Variable lacuna (Lacuna variegata)

Smooth-edged wenteltrap (Opalia borealis)

White dorid (Archidoris odhneri)

Nanaimo dorid (Acanthodoris nanaimoensis)

Cockerel’s dorid (Laila cockerelli)

Opalescent aeolid (Hermissenda crassicornis)

Red-gilled aeolid (Flabellina verrucosa)

 Common gray mysid (unknown) ?

Coon-stripe shrimp (Pandalus danae)

Kincaid’s commensal shrimp (Heptacarpus kincaidi)

Giant or giant acorn barnacle (Balanus nubilis)

Oregon crab (Cancer oregonensis)

Masking or sharp-nose crab (Scyra acutifrons)

Flat porcelain crab (Petrolisthes cinctipes)

Turtle or butterfly crab (Cryptolithodes typicus)

Flat, granular-claw hermit crab (Elassochirus tenuimanus)

Sponge hermit crab (Pagurus stevensae)

Blood star (Henricia leviuscula)

Long-rayed or rainbow star (Orthasterias koehleri)

Sunflower star (Pycnopodia helianthoides)

Sun star (Solaster stimpsoni)

Serpent or daisy brittle star (Ophiopholis aculeata)

Green sea urchin (Strongylocentrotus droebachiensis)

Giant red sea urchin (Strongylocentrotus franciscanus)

Purple sea urchin (Strongylocentrotus purpuratus)

Giant or California sea cucumber (Parastichopus californicus)

Red sea cucumber (Cucumaria miniata)

Creeping pedal or armored sea cucumber (Psolus chitonoides)

  MPacific herring (Clupea harengus pallasi) school of juveniles

Blackeye goby (Coryphopterus nicholsi)

Mosshead warbonnet (Chirolophis nugator)

Longfin gunnel (Pholis clemensi)

Copper rockfish (Sebastes caurinus) one adult

Puget Sound rockfish (Sebastes emphaeus) school of 200 juveniles

Kelp greenling (Hexagrammos decagrammus)

Scalyhead sculpin (Artedius harringtoni)

Broad-base tunicate (Cnemidocarpa finmarkiensis)

Horse-shoe or disc-top tunicate (Chelyosoma productum)

Stalked, dwarf light-bulb tunicate (Pycnoclavella stanleyi)

Orange social tunicate (Metandrocarpa taylori)

White-crust compound tunicate (Didemnum albidum)

The PEDDER BAY MIDDEN Lab

PEDDER BAY MIDDEN

Just west of Pearson College in Pedder Bay is a bank along the estuary which is being eroded under the roots of a large Douglas Fir. We do a field lab there using the evidence from the First nations midden to piece together a picture of what the original system of Pedder Bay must have been like when First Nations people lived in the area, several centuries ago.


We are able to make observations of the exposed midden shell fragments and determine the species of shellfish harvested here. One interesting find was a shell of a native rock oyster, a species that is no longer found in Pedder Bay, but which was obviously part of the diet several hundred years ago.

The objective of this lab is to construct a systems diagram of this Bay Ecosystem which includes these early indigenous  people

Ecological Succession Lab-Part 1. BIOMASS

ECOLOGICAL SUCCESSION-PART 1. BIOMASS
Objective 2.3.6,
Background reading reference, Odum page 193-194,
PART 1: LAB ON BIOMASS ACCUMULATION ON SUCCESSION PLATES
PROCEDURE:1. You will be taken to the docks where you will retrieve a succession slide box that has been left suspended in the bay for the past year. Return to the lab and clear off all life forms, (mostly invertebrates) that have grown in that time.

2. Separate the organisms into different species groups. Identify the groups to family or genus level and put them in the small trays provided and leave for at least 24 hours in the marine dryer. You may as an option at this point take a wet biomass determination.

3. Weigh the species in order to get a dry biomass of the different life forms.

4. Calculate the surface area from which the organisms were removed .

5. Do a biomass determination on each species — grams per square cm.

6. Enter your own results in an Excel chart on the computer. Produce a pie graph of the results.7. Obtain the raw data from the other teams in the class and make another graph of the cumulative results.
Discussion:1. Referring to page 194 of Odum, explain how biomass in a community is affected by succession.

2. Design the protocol of a lab using similar materials that you could use to test this theory and that of how species diversity is affected by succession .

3. Compare your graph with the total class results. What would you consider to be the best result and why? (use the word replication in your answer)
 :
ECOLOGICAL SUCCESSION IN PEDDER BAY -PART 2
Objective: 2.3.5 ,Objective 2.3.6,
Background reading reference, Odum page 186-207
PART 2 :Succession –
PROCEDURE:1.Place 10 clean microscope slides in a cleaned succession slide box.

2.Suspend the box in 1 meter of water in the designated location on the docks.

3. After 2 weeks, remove one slide and examine 5 fields of view under 100X in the compound microscope. Use the diagrams and booklets provided to identify the species to the genus level.4. Tally the number of each species in each field of view and then make a cumulative tally. It may help to make sketches of the species in order to be able to associate a name with the appearance.

5. In EXCEL , enter your counts and make a pie chart of the results which is labelled with % as well as number for each species.

6. Repeat this procedure at two week intervals, for at least 8 weeks.

OPTION A: Compare your results with those freom previous years: Consult the teacher if you wish to do more complex statistics on the variations observed.

OPTION B: Add to the collection of photographs of diatoms .

OPTION C: Dip at least one slide in the antifouling compund ” EASY NET” and compare after 8 weeks the effectiveness of this treatment.

Discussion:1. Referring to page 193- 194 of Odum, explain how species diversity in a community changes with succession. Provide evidence from your work to support or reject this theory.

2. Examine the model provided for a similar succession sequence from Oregon waters. Using that model , make your own flow chart to compare the two locations.

EVALUATION: Include an extensive evaluation of the lab.

The Metchosin Biodiversity Strategy

PURPOSE: This draft document was prepared in the 1990s by local resident and International authority on Biodiversity Strategies, Robert Prescot Allen. Modifications and input from the Metchosin Advisory Commission and the students of the Environmental Systems class at Lester B. Pearson College have been included.  The purpose of the strategy is to enable the Council and residents of Metchosin to fulfill the commitments to conserve biodiversity as expressed in the Official Community Plan.

We welcome any comments and seek input on how this may be improved.


RATIONALE FOR A BIODIVERSITY STRATEGY FROM THE OCP:( Official Community Plan)

2.2.2 To promote the conservation of the biodiversity of the district – the variety of natural communities, native wild species and populations, and domesticated species and populations.

2.2.3 To maintain creeks, streams and inland wetlands in their natural state, by minimizing the impact of development.

2.2.4 To maintain uplands, forested lands and areas with old growth Douglas Fir in their natural state, by minimizing the impact of development.

2.2.5 To manage marine shorelands in a manner compatible with the biological and physical processes acting on and within them.

2.2.6 To identify and preserve sensitive natural environments for future generations and to maintain sufficient lands in their natural state so that rare and diverse plant and animal life will continue to exist and flourish.

2.2.9 To promote the restoration of marginal agricultural and /or previously degraded land to wildlife habitat.

Commitments to conserve biodiversity may also be found in the OCP’s general environmental policies and policies on lakes, creeks and streams; inland wetlands; marine shorelands; wildlife habitat; unique and attractive vegetation and tree cover.

The Garry-Oak Douglas fir zone is probably the most threatened ecological region in North America. It is restricted to southeastern Vancouver Island, The Gulf and San Juan Islands, The Puget trough and Willamette valley ( the rain shadow zone East of the mountains of Vancouver Island, Olympic peninsula and Washington/ Oregon Coast) Most of this zone has already been converted to farms and residential areas or has been heavily modified. Little natural Ecosystem remains. Municipalities that still have significant tracts of this ecological zone have something very valuable and unique. It is an obligation and service to the more urbanized municipalities and to future generations to maintain this heritage.


OBJECTIVES:

The ultimate objectives of this strategy are to:

  • Maintain viable populations of every species native to Metchosin.
  • Maintain viable samples of every natural community in Metchosin.
  • Initial priority will be given to species and natural communities that are endangered, threatened or rare nationally , provincially or regionally.

The Enabling Objectives of the strategy are to:

  1. Increase the number of residents who value native species and natural communities and are committed to conserving them.
  2. Increase social and economic incentives fore maintaining native species and natural communities.
  3. Increase legal support for maintaining native species and natural communities.
  4. Improve information on native species and natural communities of Metchosin and on introduced species that threaten them.
  5. Develop the Organizational capacity to maintain native species and natural communities.
  6. Obtain the resources required to maintain native species and natural communities.

VALUES:

Objective 1: Increase the number of residents who value native species and natural communities and are committed to conserving them.

  • Action: 1.1 Produce and distribute a leaflet describing the uniqueness and heritage value of the natural communities and native species of Metchosin.
  • Action 1.2 Prepare a high quality presentation on the uniqueness and heritage value of Metchosin’s native species and natural communities and the Biodiversity Strategy for Metchosin. This should be suitable for public gatherings and a TV presentation.
  • Action 1.3 Prepare and promote a “collaborative” style Internet site on Metchosin biodiversity, and the Biodiversity Strategy.
  • Action 1.4 Contact local schools to determine the extent of curricular involvement at present with Metchosin biodiversity. Enlist the help of teachers and students to contribute to identifying and promoting conservation of biodiversity.
  • Action 1.5 Prepare a demonstration booth for Metchosin Day which is designed to heighten public awareness on biodiversity issues of the community.
  • Action 1.6 Promote artistic performances on biodiversity themes to heighten awareness in the community.

INCENTIVES

Objective 2 : Increase social and economic incentives fore maintaining native species and natural communities.

  • Action 2.1 : Develop ways of increasing people’s self esteem and social standing if they do something to conserve native species and natural communities.
  • Institute community recognition of conservation efforts.
  • Encourage cooperation between neighbors to join up areas of greenspace.
  • Set time-lines for community achievement of greenspace designation .
  • Establish a high profile “community green map”.
  • Action 2.2 : Provide financial incentives (e.g. tax breaks) for maintaining native species and natural communities. Land dedicated to conserving native species and natural communities should be taxed at a rate low enough to encourage people to do so ( just as agricultural land is taxed at a favorable rate).

Recommended Steps: Draft a proposal

Council endorses proposal

Provincial government is lobbied to support the proposal

Lobby other municipalities to obtain support.

  • Action 2.2 : Provide financial incentives for restoration of degraded habitat. This could be done where there are agricultural areas overgrown with weedy species.

LAWS

Objective 3: Increase legal support for maintaining native species and natural communities

  • Action 3.1: Develop and implement an optimal zoning strategy for maintenance of native species and natural communities. Current zoning is not the most suitable for the conserving of biodiversity. A more flexible zoning system might help property owners dedicate land for conservation while meeting their economic priorities. The ecosystem unit should be taken into account when providing for subdivision or development. Certain ecosystem components must not be compromised if we are to maintain viable populations of native species.

Recommended steps: (I) Discuss what an optimal and achievable zoning system based on an ecosystem component approach would look like.

(ii) Prepare a proposal

(iii) Submit the proposal to Council and residents;

(iv) Amend the OCP and Land Use bylaw to accommodate biodiversity.

  • Action 3.2 Make available to property owners detailed information on the process of providing for covenants.

KNOWLEDGE

Objective 3: Improve information on native species and natural communities of Metchosin and on introduced species that threaten them.

  • Action 4.1 Prepare and maintain an inventory of native species and natural communities of Metchosin. This would be part of the Metchosin Environmental Inventory which has already been started.

Immediate needs:(i) Compile a list of native species (plants; vertebrates; macro-fungi)

(ii) Compile a list of natural communities

(iii) Identify native species of concern( endangered, threatened, rare)

(iv) Identify natural communities of concern (endangered, threatened, rare)

(v) Complete mapping of natural communities.

  • Action 4.2 Prepare a list of introduced species of concern ( i.e. that threaten native species or natural communities) and identify priority species for control.
  • Action 4.3 Identify a process for updating the inventories in order to keep information current.
  • Action 4.4 Involve all components of the community in the inventory process. Develop incentives for school children to contribute to the inventory.

ORGANIZATION

Objective 5: Improve information on native species and natural communities of Metchosin and on introduced species that threaten them.

  • Action 5.1 Form an organization of property owners and other individuals who will commit themselves to taking particular actions. (The Metchosin Organization on Biodiversity)
  • Action 5.2 Form an alliance with other community groups, service clubs, Environmental Organizations. Explain the strategy and enlist them as partners. Discuss what they and their members could do to develop and implement the strategy.
  • Action 5.3 Encourage and link up with similar activities in other municipalities.

RESOURCES

Objective 6: Obtain the resources required to maintain native species and natural communities.

  • Action 6.1 Prepare a budget for actions 1 through 6 . define preliminary targets for meeting the budget
  • Action 6.2 Ask council to commit itself to its share and front the money for actions 1.1 and 1.2 (required for fund raising and recruiting partners)
  • Action 6.3 Prepare and implement a plan to raise the balance of the budget.

SPECIAL ISSUES

Control of Introduced Species:

The introduced species that are of concern are those that because of their opportunistic nature, have a negative impact on native species and the re-establishment of native species.

  • Action 7.1 : Prepare and distribute to property owners a pamphlet emphasizing the importance of control of introduced species. Develop a recognition method for certification of areas that are free of introduced species.
  • Action 7.2 : Prepare priority plans for the removal of other introduced species that can destroy species diversity. Gray squirrels, starlings and rabbits may be appropriate candidates. Recognition may be made of some species, e.g. Blackberry that should be controlled in areas that could be rehabilitated with native species.
    For a reference on current research on Gray Squirrels see: This link. 
  • Action 7.3 : Encourage property owners to remove Scotch broom and gorse from their land. Develop an incentive scheme for broom eradication and restoration of native species.
  • Action 7.4.: The municipality of Metchosin will commit themselves to removing appropriate introduced species such as broom from their properties. Other public authorities, (e.g. BC Hydro) will be advised of the need for a control program .

Management of land to Encourage Native Species and Natural Communities.

  • Action 7.5 : Produce and distribute advice to landowners on ways they can manage their land to best encourage native species and natural communities.
  • Action 7.6 : Prepare and implement a plan for management of public lands, including right of ways, trails, to encourage native species, and to control introduced species.

PROTECTION:

  • Action 7.7 : Identify and protect by legislation priority areas in the municipality. Emphasis will be placed on the largest remaining intact areas of natural or near- natural ecosystems. Comprehensive management plans to ensure long-term protection must be done for each area.