The Metchosin 2010 Sustainability Report: Building Resilience for Uncertainty.
( Note: this has been converted from a WORD document, so some formatting has been changed)
March 29, 2011
EXECUTIVE SUMMARY
In 2009 the District of Metchosin signed the British Columbia Climate Action Charter, committing the District to reducing greenhouse gas (GHG) emissions. The high environmental and financial costs of dependency on fossil fuels and the potential effects of climate change make Metchosin vulnerable to a range of new challenges, including increased costs for municipal services, vulnerability to food and water shortages, and increased risk of natural disasters.
This report outlines ways in which the District and residents can prepare for these challenges by building resilience and sustainability into the community through personal choices and careful government decision making and it provides recommendations for action in a number of specific areas.
SUMMARY OF RECOMMENDED ACTIONS
FORESTS
Metchosin’s existing protected areas, current zoning, and tree cutting bylaws will help to maintain tree cover in our largely forested municipality and thereby facilitate carbon storage and reduce water run-off and erosion. The following recommendations will further enhance Metchosin’s ability to protect habitat and store and sequester carbon.
- Celebrate the values associated with Metchosin’s forests-including carbon sequestration and storage-and maintain current municipal efforts to protect them;
- Increase protected forest lands in Metchosin, where agriculture is not affected;
- Consider forest restoration and better management of our existing forests (for example, through invasive species control);
- Increase awareness of issues such as insects and disease in our forests, and consider implementing a program such as FireSmart to reduce the risk of forest fires.
MARINE COASTLINE
Metchosin’s existing shoreline slopes development permit area, large lots and low density zoning have helped to reduce development impacts along coastlines, and have protected marine coastal habitat and its ability to store and sequester carbon. Metchosin will help achieve sustainability and resiliency in its coastal areas by implementing the following:
- Lobby senior governments to recognize that municipalities are often the first to notice problems along their marine coasts and municipalities need the authority to protect these ecosystems;
- Consider zoning all marine shorelines in Metchosin as a development permit area in order to protect their natural values;
- Establish a program to document and monitor coastal resources, including eel-grass and kelp beds, and forage fish habitat, with the goal of ensuring no net loss of those resources;
- Produce a pamphlet to help educate both the public, and land owners with property bordering on the shoreline, of the sensitivity of coastal ecosystems, in order to reduce harmful impacts on coastal ecosystems;
- Identify and map areas important to forage fish and consider a method of restricting beach fires and other damaging activities in these areas at times of the year which are sensitive for forage fish.
GROUND and SURFACE WATER
Water is fundamental to all living things and locally we must ensure the continued quantity and quality of our water supply. Metchosin has done much to ensure the protection of its surface waters with the Rainwater Protection and Management bylaw. Two of Metchosin’s lakes, Matheson and Blinkhorn, have no development around their shores, which protects their healthy aquatic and riparian ecosystems. The Bilston Creek Development Permit Area zoning reduces the impact of development on Bilston Creek. The following actions will further protect the District’s critically important water resources:
- Incorporate into the OCP recognition of the importance of sustaining our surface water, groundwater, and water table (i.e., aquatic systems) in order to provide safe, clean water for our needs while ensuring sufficient water for natural (ecological) systems;
- Develop a groundwater protection bylaw to protect groundwater quality and sustainability into the future;
- Consider control of aggressive introduced species that lead to rapid infill of wetlands (e.g. purple loosestrife and yellow iris);
- Encourage the restoration of wetlands;
- Encourage the orderly flow of piped water, to extend the life of the CRD water infrastructure as long as possible into the future;
- Promote rainwater harvest, xeriscaping, and efficient irrigation to conserve groundwater;
- Protect groundwater and all bodies of water from pollution;
- Support changes to building and plumbing codes to permit the reuse of greywater, for activities where it is deemed safe.
- Encourage farmers to improve agricultural irrigation water productivity (e.g. drip irrigation).
GREEN AND BLUE SPACES
Metchosin is fortunate to have considerable intact natural areas. It is important to preserve unprotected green and blue spaces, in part to maintain the ecosystem services they provide. Ways to ensure this are:
- Lobby the provincial government to protect provincial Crown lands in Metchosin as parkland;
- Lobby the federal government to protect/preserve the ecological integrity and natural areas of the lands it owns (i.e., Mary Hill, Rocky Point, and Albert Head);
- Support efforts to protect areas identified in the 2011 Parks report (Report on Ecological Values of Potential Park Acquisitions), the OCP and the Blue/Green Spaces Strategy;
- Support residents and other organizations in their desire to protect the natural values of their properties through placing voluntary conservation covenants on their properties.
AGRICULTURE
Maintaining and expanding local agriculture is an important component of the strategy to enhance Metchosin’s ability to respond to the threat of a changing climate and dependence on off-Island food sources. The following actions will help protect the District’s agricultural potential:
- Support and enhance the Agricultural Land Commission ‘s mandate to preserve agricultural lands for agriculture;
- Maintain and, where possible, strengthen the protection of agricultural land, possibly through the adoption of an Agriculture Area Plan;
- Support efforts to improve public awareness of local agriculture and farmer access to local markets;
- Support sufficient vending opportunity in Metchosin and other area markets;
- Support programs providing educational and extension services to new farmers, including workshop, demonstration, mentorship and other services;
- Support and encourage local abattoir capacity;
- Support and encourage local agricultural producers;
- Support the Peninsula Agriculture Commission as regional venue to protect and preserve agriculture in southern Vancouver Island;
- Support sustainable greenhouse capability;
- Support edge planning (buffering/hedgerows) around individual farms and around the ALR;
- Support initiatives to improve long term leasing opportunities for agriculture;
- Consider options for improving agricultural irrigation water productivity (eg drip irrigation);
- Encourage and support organic farming practices and ecological stewardship;
- Encourage the most efficient use of ground and surface water possible;
- Educate the public on the control of invasive and noxious weeds, such as Tansy ragwort, gorse and Scotch broom;
- Support initiatives for opportunities for small farmers to increase and diversify incomes through value-added products, agricultural services, and on-farm processing;
- Support Vancouver Island University’s proposed Agriculture Resource and Innovation Centre as a vehicle for the provision of education and extension services to Vancouver Island farmers.
RECREATION
Metchosin residents have many opportunities to enjoy recreational activities at home instead of traveling to other municipalities. Some ways to increase these opportunities are:
- Encourage the use of Metchosin sports facilities by promoting more participation by Metchosin residents (e.g. cricket field, tennis court, riding rink and dirt jump park);
- Encourage partnerships with the YM/WCA-Camp Thunderbird, the Boys and Girls Club-Metchosin Wilderness Camp, local schools, Pearson College and other appropriate organizations, for expansion of the use of their facilities to Metchosin residents;
- Consider a partnership to develop an all-weather playing field and to promote the expanded use of the cricket field.
ENERGY AND GREEN HOUSE GAS EMISSIONS
- TRANSPORTATIO
Transportation is cited as the leading cause of Metchosin’s green house gas (GHG) emissions. In order to reduce the District’s GHG emissions, it is important to improve access to public transportation and to overcome the community’s reluctance to use it. The following actions will help:
- Continue to improve the availability of public transportation, bus shelters, secure bike storage, park & rides and carpooling by liaising with BC Transit and promote these travel options through public education;
- Continue to improve pedestrian and non-motorized corridors (trails) by constructing bike lanes and trails where applicable and when funding permits;
- Encourage and support a vehicle sharing co-op;
- Consider the environmental standards of any vehicle purchased by the municipality and make purchases that best support the municipal objectives and the environment;
- Review road design standards for municipal roads to ensure that they are in keeping with the character of the District, that they minimize environmental degradation and the potential for erosion, that they foster traffic safety and that they permit the safe and proper access for emergency and road maintenance vehicles;
- As technology and funding opportunities become available, facilitate the establishment of an electric vehicle recharging station in the village centre.
2. BUILT STRUCTURES (including Residential)
The District has committed to reducing GHG emissions over 2007 levels by 33% by 2020. Buildings account for 13.8% of emissions. The provincial government has authority over the building code. Lobbying the province for changes which will enable greener buildings will help reduce emissions. Additional ways to achieve this are:
- Consider land use decisions, as appropriate for Metchosin, based on changes in, and projections of, groundwater and aquifer levels, snow loads, extreme rain and droughts, greater storm surges along the shoreline. Revise snow load requirements, road drainage plans, floodplain and shoreline regulations and locally-adapted fire smart guidelines as needed;
- Continue to assess bridges, septic systems and new infrastructure in floodplains using 100-200 year flood projections;
- Lobby the province for changes to the Building Code that allow for greener building practices (e.g. greywater reuse systems, composting toilets);
- Require all new construction to have minimal environmental impact, including minimizing GHG emissions;
- Encourage policies promoting building methods that have minimal impact on ecosystems and landscape;
- Continue to encourage building practices that minimize or offset the loss of pervious surfaces (see District Rainwater Management bylaw);
- Allow other green building policies that can be demonstrated to meet the functions and safety objectives of the building code while protecting the interests of future owners, such as green roofs, night sky friendly lighting, etc.;
- Post a personal carbon footprint calculator on the District website;
- Post information on the District website about the latest technological innovations on energy use reduction strategies (e.g., see appendix 5);
- Post government sponsored homeowner initiatives for carbon footprint and energy use reduction on the district website with links to Energy Canada (http://oee.nrcan.gc.ca/english/), LiveSmart BC (http://www.livesmartbc.ca/), BC Hydro (http://www.bchydro.com/), and BC Sustainable Living (http://www.bcsea.org/solutions) websites (see appendices 3, 4);
- Investigate ways in which the District might help residents with renewable energy installations and energy efficiency improvements costs, and consider the concept of Local Improvement Charges;
- Provide education on, and encourage, building upgrades regarding energy and water use, such as low flush or composting toilets, energy and water efficient appliances, rainwater storage, green roof, low emission windows, heat recovery systems including ground loop energy systems and solar electric and solar thermal energy systems;
- Encourage building new structures to have net zero energy and water impact;
- Encourage home energy audits, a first step to help inform home and business owners on their options when considering energy efficiency upgrades (such as sealing window and door drafts);
- Develop relevant plans regarding emergency management to take into account increased forest fire risk, flooding, and wind, rain and snow storms;
- Consider methods to reduce the footprint of buildings and non-food producing activities on agricultural land (eg encourage compact homes, shops, barns) and that the house and accessory building(s) and storage (parking) footprint does not affect agricultural production and viability.
- SOLID WASTE
Metchosin residents are responsible for the disposal of septic wastes. The CRD has a well used recycling system in place, which is continually undergoing innovative change. Further suggestions for the District are:
- Encourage the use of techniques which separate greywater from other sources of liquid waste so that greywater can be stored and used for irrigation (excluding irrigation of crops for human consumption);
- Lobby for changes to building and plumbing codes to permit the reuse of greywater and composting toilets;
- Encourage residents to maintain their septic systems to proper functioning condition and make information about proper septic system construction and maintenance available to Metchosin residents;
- Consider the development of a municipal compost yard;
- Encourage residents to adopt practices to contain household and kitchen garbage in secure, bear-proof receptacles.
TABLE OF CONTENTS
| Executive Summary ——————————————————————————– |
1 |
| Table of Contents ———————————————————————————— |
6 |
| Introduction ——————————————————————————————– Climate Action Charter —————————————————————- |
78
|
| Forests ———————————————————————————————- |
11 |
| Marine Coastline ————————————————————————————- |
12 |
| Ground and Surface Water ————————————————————————– |
14 |
| Green and Blue Spaces —————————————————————————— |
16 |
| Agriculture ———————————————————————————————— |
17 |
| Recreation ———————————————————————————————— |
19 |
| Energy and Green House Gas Emissions ——————————————————Transportation ——————————————————————————–Built Structures (including Residential) ————————————————-
Solid Waste ———————————————————————————— |
2020
21
24 |
| Appendix 1Metchosin Community Energy and Greenhouse Gas Emissions Inventory: 2007 –— |
26 |
| Appendix 2Mitigating and Adapting to Climate Change through the Conservation of Nature —– |
28 |
| Appendix 3Examples of Canadian Grant Initiatives ———————————————————- |
29 |
| Appendix 4Examples of Federal support for Home Retrofits October 2010 —————————- |
30 |
| Appendix 5Currently Viable Energy Initiatives —————————————————————– |
31 |
| References ———————————————————————————————- |
32 |
| Further Reading —————————————————————————————- |
|
INTRODUCTION: SUSTAINABILITY AND RESILIENCE
In 2009, the District of Metchosin signed the British Columbia Climate Action Charter, committing us to reducing our GHG emissions. The high environmental and financial costs of dependency on fossil fuels and the potential effects of climate change make Metchosin vulnerable to a range of new challenges, including increased costs for municipal services, vulnerability to food and water shortages, and increased risk of natural disasters.
This report outlines ways in which the District and residents can prepare for these challenges by building resilience and sustainability into this community through personal choices and careful government decision making, and provides recommendations for action in a number of specific areas.
The report addresses the following diverse but related topics: Forests; Marine Coastline; Freshwater; Green and Blue Spaces; Agriculture; Recreation, and Energy and Greenhouse Gas Emissions (Transportation, Built Structures, and Waste). Under each topic we review context (how the topic is related to the goals of resilience and sustainability) and issues (how the topic pertains specifically to Metchosin), and provide recommendations for both the municipal staff and the citizens of Metchosin.
The terms sustainability and sustainable development can have very different meanings for different people. In its simplest interpretation, sustainability implies managing social, economic and ecological systems in order to sustain healthy communities and healthy ecosystems. This is the definition of sustainability that is adopted for this report.
An essential aspect to sustainability will be achieving the ability to absorb, recover and adapt to conditions and events we cannot predict. In other words, we must manage our communities and regions for resilience in every sector, from the infrastructure we build, to the social systems that bind us together in coexistence and cooperation, to the ecosystems that provide services essential to our survival.
Resilience – the ability of a system to absorb shocks, to avoid crossing a threshold into an alternate and possibly irreversible new state, and to regenerate after disturbance (Resilience Alliance, 2009).
The challenges ahead are immense and will require global cooperation among nations if we have a hope of solving them; but the local level is where this translates to concrete and measurable action. Community sustainability and resilience are improved by addressing a wide variety of sectors, from human social and economic systems and human built systems to ecological systems.
Responding to climate change and resource uncertainty requires the following:
- mitigation of climate impacts through a reduction of fossil fuel use and greenhouse gas (GHG) emissions (e.g. cycling trails);
- adaptation of our activities and infrastructure for the unavoidable impacts, regardless of current mitigation measures (e.g. building infrastructure to 100-200 yr flood levels);
- conservation of the ecosystem that provides life supporting services to us (e.g. protecting forests);
- management of the resources we have (e.g. water conservation).
These four themes – climate mitigation, climate adaptation, ecological conservation, and resource management – underlie and are addressed by the various topics covered in this report. By acting to address these specific areas, we will make significant strides towards ensuring comprehensive community sustainability and resilience for Metchosin into the future.
Action has already begun in the form of the BC Climate Action Charter – a climate mitigation and resource management measure to which Metchosin is a signatory – which commits the municipality to achieving GHG neutrality within its municipal operations by 2012 and a municipality-wide reduction of 33% by 2020. This report provides recommendations on how to work toward this commitment.
CLIMATE ACTION CHARTER
The Province of BC created a Climate Action Charter that states in part:
1 (e) governments urgently need to implement effective measures to reduce greenhouse gas (GHG) emissions and prepare for climate change impacts.
In 2009, the District of Metchosin signed the Climate Action Charter. Our community is committed by the Charter to the following goals:
- i. being carbon neutral which respect to our operations by 2012,
- ii. measuring and reporting on our community’s GHG emissions
The third goal of the Charter is written primarily for urban communities:
- iii. creating complete, compact, more energy efficient rural and urban communities (e.g. foster a built environment that supports a reduction in car dependency and energy use, establish policies and processes that support fast tracking of green development projects, adopt zoning practices that encourage land use patterns that increase density and reduce sprawl.)
Metchosin feels that the rural and natural character of the municipality require a different and complementary approach to achieving the objectives of the charter – especially the third objective. For example, the Charter calls upon municipalities to
“adopt zoning practices that encourage land use patterns that increase density …” as a means of creating “compact, more energy efficient … communities.”
Increasing density is in direct conflict with Metchosin’s 1995 Official Community Plan (OCP). Metchosin must adopt its own, rural approach to addressing its commitments under the Charter. This will include maintaining the slow growth philosophy of the district, where small and slow is better.
In 1984, the district’s OCP projected a twenty year build-out population of 6,170; the census of 2006 reports a population of 4,795, significantly less than projected and a decrease from the previous census. In addition, Metchosin is a forested community with an agricultural base, important components in a complementary strategy to address climate change while maintaining and building resilience in the District.
The Climate Action Charter states in:
1. (a) the scientific consensus is that increasing emissions of human caused greenhouse gases (GHG), including carbon dioxide, methane and other GHG emissions, that are released into the atmosphere are affecting Earth’s climate.
By maintaining large lot zoning and low population density, the district is able to retain its forested and agricultural land base and relatively pristine marine shoreline. In retaining its forested land base the District reduces the release of new carbon emissions into the atmosphere that would result from conversion of the natural landscape (through tree cutting and development), and continues to act as a carbon sink by sequestering carbon in its forests. Most of Metchosin’s forests are under eighty years of age and are, therefore, in a rapid carbon sequestering trajectory, benefiting the district and the region. Low density development and zoning has also reduced the potential for severe degradation of coastal marine ecosystems, which sequester and store carbon at a far greater rate than forests.
Protection of the agricultural potential of the community has long been a District priority. Local food production, by helping to reduce reliance on imported food with its attendant transportation and GHG emissions, is another method of reducing carbon use and building resilience into the community.
By signing the Climate Action Charter, the District recognizes that it has a duty to further address GHG emissions and to protect the community from the impacts of climate change, increasing energy costs and global instability by building resilience into the framework of the decision making process. Dependence on fossil fuels limits the District’s ability to make choices that protect the environment and food security, and affects decisions on financial matters that impact taxes.
To address the District’s commitments under the Climate Action Charter, Metchosin needs to do two things: reduce the amount of GHGs emitted, and increase (or at least maintain) the amount of GHGs that our plants pull out of the air (sequester). The District has always supported local agriculture, home based businesses, volunteer oragnisations, seniors initiatives, large lot zoning, environmental bylaws and others which help to mitigate GHG emissions.
To reduce emissions, it helps to understand where they are currently coming from. The province prepared Community Energy and Emissions Inventories in 2007 as a baseline to determine GHG emissions. Metchosin’s total GHG emissions for 2007 have been measured at 23,395 tons/yr (see Appendix 1). The three major contributors are: transportation (84%); buildings (13.8%); and solid waste (2.2%) (see diagram on next page). The three chapters, Transportation, Built Structures and Solid Waste, provide suggestions about how the District might reduce GHG emissions from these activities.
Source: Metchosin: Community Energy & Greenhouse Gas Emissions Inventory: 2007
To increase (or at least maintain) the amount of GHGs that the plants in Metchosin pull out of the air, the District must protect, and sometimes restore, the capacity of Metchosin’s ecosystems to sequester carbon – to photosynthesize. That is what much of the sections on Forests, Marine Coastline and Green and Blue Spaces are about.
The sections on Freshwater, Agriculture and Recreation provide measures that build and maintain resilience by providing local choices (sufficient clean water supply, food and local recreational opportunities) that can help sustain the community in times of change.
These recommendations will help Metchosin address its commitments under the Climate Action Charter – referred to earlier as mitigation. But they will also allow the District to build a community that is more resilient to inevitable changes in climate – that is, allow Metchosin to adapt to climate changes and the looming threat of peak oil. Protecting and enhancing ecosystems to ensure that they absorb greenhouse gases also protects those ecosystems for the other things that are valued – for biodiversity, for fish and wildlife, for recreation, and for the beauty that surrounds us.
FORESTS
Context
In 2005, approximately 5,634 hectares of Metchosin were forested. This amounts to about 76% of the District. Forest cover maps from the mid-19th century show almost all of Metchosin as forested. Most of Metchosin’s forests were logged in the early 20th century and have subsequently re-grown into mature 2nd-growth forest. Approximately 24% of Metchosin is currently non-forested, representing areas that have been cleared for agriculture, residential development and recreation (e.g., golf courses, playing fields).
Metchosin’s forests belong to the Coastal Douglas-Fir (CDF) ecological zone and the Very Dry Maritime Coastal Western Hemlock subzone (CWHxm). Both ecological zones have little remaining old-growth forest and a low percentage of protected areas. This means that Metchosin’s forests represent some of Canada’s most endangered forest types. The Department of National Defense (DND) lands at Rocky Point and Mary Hill contain the best remaining examples of CDF old forest globally. Most of Metchosin’s existing protected areas are forested.
Metchosin has more forest than any other Capital Regional District (CRD) municipality – almost 20% of all CRD forest is in Metchosin. Our current zoning and bylaws reflect our vision of maintaining a rural and natural environment, and help protect our trees and forests.
Metchosin’s forests are important for many reasons: as wildlife habitat; as a carbon sink and store; as a source of firewood; timber and non-timber forest products (such as mushrooms and floral greens); for intercepting rainfall and stabilizing slopes; for shade for people, aquatic species and animals; and for the aesthetic and spiritual values they impart to Metchosin. Protecting Metchosin’s forests also protects the ‘ecosystem services’ they provide (clean air, water and other necessities of life).
It is estimated that southern Vancouver Island’s old-growth Douglas-fir forests store approximately 500-700 tonnes/ha of carbon (Trofymow et al. 2008). Metchosin’s forests, mostly maturing second-growth, will contain less. Still, even if we assume a conservative measure of 300 tonnes/hectare, Metchosin’s forests contain at least 1.5 million tonnes of carbon. These forests sequester an additional (approximately) 1 tonnes/ha/yr, absorbing one quarter of Metchosin’s emissions. If areas are logged and replanted, carbon will be lost to the atmosphere, and it will take decades until that new forest is pulling in carbon at the same rate as the forest that was logged. If the area is logged and not regenerated as forest, the ability of that ecosystem to sequester carbon will be permanently lost (appendix 2). Maintaining (or increasing) Metchosin’s forested area is an important component of Metchosin’s overall GHG strategy.
Metchosin’s Tree Management Bylaw (287) limits the number of trees that may be removed annually without a permit and gives further protection to some species of trees.
Using wood from Metchosin’s forests as fuel – simply as firewood in our woodstoves or as a component of some more complex biomass energy generation program – is generally considered as a carbon-neutral source of energy (this assumes, among other things, that the wood is sustainably harvested). There may also be options to use a farm field for bioenergy production (such as fast-growing willow shrubs) to provide energy for a small biomass burning facility in the Village Centre to provide heat for the various municipal buildings and other Village centre facilities. This would require some investment – but may be one way to reduce Metchosin’s dependence on imported energy (and electricity) and to make use of local resources.
There may be opportunities to generate revenue through long-term legal protection of forested areas utilizing conservation offsets, a form of carbon offset. The price of a carbon offset on the Pacific Carbon Trust range from $10-$25/tonne and on the international Voluntary Carbon Standard registry from $3-$15/tonne (Briony Penn, 2010). However, these might have to be newly protected (not existing protected) areas and there is currently much uncertainty about how this newly-emerging market will work.
Issues:
- Between 1986 and 2005, Metchosin’s forested area (tree cover density >50%) declined by 505 hectares (8.2%). This appears to be because of residential and golf course development, and clearing for agriculture;
- Long term (100+ years) legal preservation of Metchosin forests is crucial to maintaining ecosystem resilience, to continue to sequester carbon emissions and as carbon storage;
- Many of Metchosin’s forests are mature second-growth forests. As our forests age over the next century or two, fuels will accumulate and wildfire risk will increase. Forest fires will endanger lives and property, but will also increase GHG emissions and reduce GHG removal from the atmosphere by reducing the number of trees.
Recommendations
Metchosin’s existing protected areas, current zoning, and tree cutting bylaws will help to maintain tree cover in our largely forested municipality and thereby facilitate carbon storage and reduce water run-off and erosion. The following recommendations will further enhance Metchosin’s ability to protect habitat and store and sequester carbon.
- Celebrate the values associated with Metchosin’s forests, including carbon sequestration and storage, and maintain current municipal efforts to protect them.;
- Increase protected forest lands in Metchosin, where agriculture is not affected;
- Consider forest restoration and better management of our existing forests (for example, through invasive species control);
- Increase awareness of issues such as insects and disease in our forests, and consider implementing a program such as FireSmart to reduce the risk of forest fires.
MARINE COASTLINE
Context:
Metchosin has 937 ha (2,314 acres) of foreshore and land covered by water (OCP, 1995), and almost 50 km of marine shoreline.
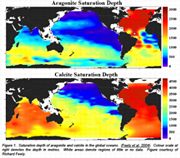
Nearshore marine habitats are reported to store carbon efficiently and in large quantities. According to a report by the International Union for Conservation of Nature (Pidgeon, 2009), oceans, particularly nearshore coastal ecosystems, sequester vast amounts of carbon in sea grass beds and salt marshes. These ecosystems are extremely efficient at burying carbon in the sediment below them, where it can remain for millennia. They can store ten times more carbon in their soils per hectare than temperate forests. While the district has no legal authority over coastal marine habitats, Metchosin’s low population density, the designation of a shoreline slopes development permit area and zoning bylaws, help to protect these areas from development that might adversely affect critical coastal habitats and carbon sinks.
Although the Crown owns the foreshore to the high tide mark there are still considerable threats to the ecological integrity of this area. The shoreline is a dynamic interface between two systems, the terrestrial uplands and the open ocean. As typical of any natural systems, they cannot be separated in terms of management decisions as they have processes which interact.
Issues:
- Metchosin has no legal authority over areas below the high tide mark and senior government departments with this authority suffer from cutbacks and low staffing levels that make protection of the marine shoreline and nearshore habitats problematic;
- Some homeowners build hard shoreline protective buffers, which cause consequent erosion to the neighbouring properties and a cycle of building further hard shoreline protective buffers. These buffers scour beaches and nearshore ecosystems and lead to shoreline habitat destruction, including damage to eelgrass and kelp beds and forage fish habitat;
- Forage fish (surf smelts and Pacific sand lance) spawn on local beaches and their spawning habitat and associated beach ecosystems are negatively impacted by increased human traffic, beach fires, and horseback riding;
- The closure of the beaches to fire activity in neighbouring districts in recent years and the increase of fires on local beaches can have an effect on beach organisms, as well as air quality;
- Destruction of shoreline vegetation by development removes valuable shade protection for migrating fish and leads to increased siltation;
- Intertidal organisms and biodiversity are highly subject to the impacts from chemicals in stormwater runoff and from human sewage effluent from poorly functioning septic systems;
- Unregulated boat traffic and motor emissions in ecologically sensitive marine areas can have a negative impacts on biodiversity;
- There is an ever-increasing risk of coastal pollution from increased tanker traffic;
- Unregulated cruise ships dumping in our waters can impact on local fisheries and ecosystems;
- DND activities, such as underwater blasting and shoreline blasting and demolition, disturb shoreline habitat and affect both resident and migratory animal species;
- Deforestation on upland slopes leads to deterioration of coastal ecosystems;
- Erosion from road building, utility and sewer installation and subdivision development carry silt into the receiving waters and has a negative impact on filter feeders (e.g. clams, mussels and anemone) in the ocean;
- Removal of materials from the coastline can contribute to coastal erosion.
Recommendations:
Metchosin’s existing shoreline slopes development permit area, large lots and low density zoning have helped to reduce development impacts along coastlines, and have protected marine coastal habitat and its ability to store and sequester carbon. Metchosin will help achieve sustainability and resiliency in its coastal areas by implementing the following:
- Lobby senior governments to recognize that municipalities are often the first to notice problems along their marine coasts and municipalities need the authority to protect these ecosystems;
- Consider zoning all marine shorelines in Metchosin as a development permit area in order to protect their natural values;
- Establish a program to document and monitor coastal resources, including eel-grass and kelp beds, and forage fish habitat, with the goal of ensuring no net loss of those resources;
- Produce a pamphlet to help educate both the public, and land owners with property bordering on the shoreline, of the sensitivity of coastal ecosystems, in order to reduce harmful impacts on coastal ecosystems;
- Identify and map areas important to forage fish and consider a method of restricting beach fires and other damaging activities in these areas at times of the year which are sensitive for forage fish.
GROUND and SURFACE WATER
Context
Within Metchosin there are creeks, streams, ponds, wetlands, seasonal watercourses, lagoons and lakes. The areas that surround these water bodies are the riparian zone and protection of the ecosystems within this zone is critical. The water bodies collectively serve essential functions in preserving the integrity of our natural water systems. Riparian zones link ecosystems within a landscape and help to circulate nutrients among different ecosystems.
Wetlands are extremely important as natural filters and runoff buffers, preventing erosion and sedimentation, and as storehouses of CO2. They are also important habitat for many species of waterfowl as well as many other birds, fishes, amphibians, mammals and insects.
All of these water features are connected to the underground water table, the groundwater which supplies our wells. All the other aquatic components feed the water table or feed off the water table; some doing both depending on the seasons. Metchosin has hundreds of drilled water wells and these wells depend of the continued health of all aquatic systems which combine to supply these wells.
It’s obvious that water supports the vegetation but the vegetation also supports the retention and distribution of water. The root systems and the organic material mixed with the soil retain water, which is ultimately used by the plants. These same root systems buffer the flow of water during heavy rains or snow melt and prevent erosion.
All our water systems contribute to the environmental health and quality of Metchosin and are a critically important consideration in any development that impacts water flow or water retention.
We are responsible for sustaining water that flows through our community as a consequence of rainfall and we have a responsibility for contributing to the conservation and management of the CRD water supply.
Metchosin has developed the Rainwater Protection and Management bylaw which states in part:
(the bylaw’s) “purpose is to provide for the protection and effective management of rainwater and drainage; to maintain and improve water quality in watercourses, water bodies and riparian-wetland areas; and to protect the “Proper Functioning Condition” of watercourses, water bodies and riparian-wetland areas throughout the District of Metchosin”
This is achieved through employing seven principles: maintain ecosystem integrity; sustainability (water resources should not be used beyond their capacity to be naturally replenished, both in quantity and quality); stewardship; accountability (the use of rainwater is a privilege); water quality; public awareness; and the protection of the rights of property owners. The Rainwater Protection and Management bylaw helps avoid changes in runoff patterns as a consequence of building homes, driveways, roads, logging, or land clearing. Metchosin’s “large lot” zoning is also critical to conserving this resource.
Issues:
- The forecast of increasingly severe summer droughts is likely to negatively impact water bodies, from lakes to creeks to groundwater. Preserving the integrity of the natural water systems will increasingly be crucial to maintaining groundwater and surface water resources. Understanding the underlying groundwater system of Metchosin will help to protect this critically important resource;
- 30% of Metchosin properties obtain their water supply from wells; dumping of toxic waste,mining, loss of tree cover and development can negatively impact groundwater supplies. Improperly functioning septic systems and overloaded agricultural systems can contribute to pollution of surface and groundwater systems;
- Lack of provincial oversight, funding, and enforcement of riparian regulations;
- Loss of trees can change the absorption of rain and the rate of runoff and lower the water table; logging is not a permitted use in most areas of the District;
- Aggressive invasive species (purple loosestrife and yellow iris) can hasten the infill of wetlands and reduce their biodiversity and ability to respond to climate change;
- Wetlands can be infilled for development or agricultural purposes, thereby negatively impacting the water table and surface waters.
- The CRD watershed and reservoir can supply sufficient water to the CRD at this time. However, a continuing growth in population and water consumption will eventually tax the available supply and the peaks of demand create the need for more infrastructure that needs to be updated more often, need to balance times of demand;
Recommendations:
Water is fundamental to all living things and locally we must ensure the continued quantity and quality of our water supply. Metchosin has done much to ensure the protection of its surface waters with the Rainwater Protection and Management bylaw. Two of Metchosin’s lakes, Matheson and Blinkhorn, have no development around their shores, which protects their healthy aquatic and riparian ecosystems. The Bilston Creek Development Permit Area zoning reduces the impact of development on Bilston Creek. The following actions will further protect the District’s critically important water resources:
- Incorporate into the OCP recognition of the importance of sustaining our surface water, groundwater, and water table (i.e., aquatic systems) in order to provide safe, clean water for our needs while ensuring sufficient water for natural (ecological) systems;
- Develop a groundwater protection bylaw to protect groundwater quality and sustainability into the future;
- Consider control of aggressive introduced species that lead to rapid infill of wetlands (e.g. purple loosestrife and yellow iris);
- Encourage the restoration of wetlands;
- Encourage the orderly flow of piped water, to extend the life of the CRD water infrastructure as long as possible into the future;
- Promote rainwater harvest, xeriscaping, and efficient irrigation to conserve groundwater;
- Protect groundwater and all bodies of water from pollution;
- Support changes to building and plumbing codes to permit the reuse of greywater, for activities where it is deemed safe.
- Encourage farmers to improve agricultural irrigation water productivity (e.g. drip irrigation).
GREEN AND BLUE SPACES
Context
Protected parks comprise 10.27% (698 hectares) of the district’s 6,942.78 ha; most of them are managed by the CRD (municipal-60 ha), 1070 ha of farmland are protected by British Columbia’s Agricultural Land Reserve (ALR), a further 70 ha are under the protection of conservation covenants.
Though not legally protected, the province’s Crown lands (618.36 ha) and the federal DND land holdings (1322.1 ha) further augment the natural landscape. DND lands have extraordinary ecological values, representing some of the rarest ecosystems and species within Canada and providing immense carbon sequestration abilities and carbon reservoirs. The municipal, regional, provincial and federal large green spaces comprise almost 55% of the district landbase. The district also holds 936.85 ha of water within its boundaries, including foreshore rights.
Metchosin’s natural areas are home to rare and threatened forested and non-forested ecosystems and species. The Garry oak ecosystem is one of the three rarest ecosystems in Canada. Forested ecosystems are critical components of a strategy that includes maintaining our carbon stores and the ability to sequester GHG emissions.
Many landowners cherish the wild creatures and landscape that surrounds them and might wish to place conservation covenants on their lands in order to protect them in perpetuity. Land trusts such as Habitat Acquisition Trust and The Land Conservancy can help residents place voluntary conservation covenants on their properties in order to protect the ecological values of natural areas. Covenants such as these are legally binding and are registered on the property title. However, landowners can still sell their properties if and when they wish. Many of these lands are forested, sequestering carbon and functioning as carbon reservoirs (sinks).
Issues:
- Although 2040.26 ha of green space contained within provincial and federal lands are not subject to development at this time, they do not have any actual protected status; future senior governments could decide to open the lands for development. These unprotected green spaces are providing important ecosystem services (such a providing clean air and water), are sequestering carbon, and hold vast reservoirs of stored carbon;
- Unprotected green spaces that are home to rare and threatened ecosystems and species can be negatively impacted by future development;
- Some unprotected green and blue spaces that are being used for recreation might face future development.
Recommendations:
Metchosin is fortunate to have considerable intact natural areas. It is important to preserve unprotected green and blue spaces, in part to maintain the ecosystem services they provide. Ways to ensure this are:
- Lobby the provincial government to protect provincial Crown lands in Metchosin as parkland;
- Lobby the federal government to protect/preserve the ecological integrity and natural areas of the lands it owns (i.e., Mary Hill, Rocky Point, and Albert Head);
- Support efforts to protect areas identified in the 2011 Parks report (Report on Ecological Values of Potential Park Acquisitions), the OCP and the Blue/Green Spaces Strategy;
- Support residents and other organizations in their desire to protect the natural values of their properties through placing voluntary conservation covenants on their properties.AGRICULTURE
Context
A substantial land base in Metchosin is devoted to agriculture with 1070 hectares of land protected by the Agriculture Land Reserve (ALR). Metchosin agriculture is further protected and encouraged through the District’s Official Community Plan (OCP), its land use policies, and an Agriculture Advisory Select Committee reporting to Council. Metchosin’s support for agriculture is also expressed through the District’s contribution of space on municipal land so that local producers can have easy access to local and regional consumers.
While the District does have an important voice in agriculture in Metchosin, much of the future of agriculture in Metchosin lies with senior levels of government and Crown Corporations such as the BC Assessment and the Agriculture Land Commission.
BC Assessment in 2008 recorded 82 properties being farmed in Metchosin’s ALR and another 70 outside the ALR. Metchosin farms tend to be small. Only a tiny minority of the approximately 150 farmers in Metchosin live without off-farm income.
Metchosin farmers grow a diverse range of products – from vegetables, fruits and root crops to poultry for eggs and meat, to sheep, cattle and pigs, and to flowers, shrubs and trees for landscaping purposes.
The lack of formal educational opportunities in agriculture on Vancouver Island is a constraint to local agriculture. To overcome this situation, Vancouver Island University is considering the establishment of an Agriculture Resource and Innovation Centre.
Issues:
While agriculture receives formal protection in Metchosin from both the ALR and the District of Metchosin, several issues threaten the long term viability of agriculture in the District. These include, among others:
- Extremely high prices for the purchase of agricultural land;
- Purchase of agricultural land for residential development and the removal of such lands from agricultural production;
- Difficulties in acquiring long-term leases of agricultural land;
- Lack of agricultural education and extension services;
- Lack of secure processing opportunity, particularly with meats;
- Climate change with warmer and wetter winters, hotter summers, less predictable weather, and more frequent extreme weather events will impact agriculture;
- Increased likelihood of new diseases, insect pests, and invasive species arising from climate change and the increase in global travel;
- Organic production can be contaminated from non-organic sources (neighbouring properties which use chemical fertilizers and pesticides);
- Improper use of agricultural land;
- Availability of sufficient water for agricultural production.
Recommendations:
Maintaining and expanding local agriculture is an important component of the strategy to enhance Metchosin’s ability to respond to the threat of a changing climate and dependence on off-Island food sources. The following actions will help protect the District’s agricultural potential:
- Support and enhance the Agricultural Land Commission ‘s mandate to preserve agricultural lands for agriculture;
- Maintain and, where possible, strengthen the protection of agricultural land, possibly through the adoption of an Agriculture Area Plan;
- Support efforts to improve public awareness of local agriculture and farmer access to local markets;
- Support sufficient vending opportunity in Metchosin and other area markets;
- Support programs providing educational and extension services to new farmers, including workshop, demonstration, mentorship and other services;
- Support and encourage local abattoir capacity;
- Support and encourage local agricultural producers;
- Support the Peninsula Agriculture Commission as regional venue to protect and preserve agriculture in southern Vancouver Island;
- Support sustainable greenhouse capability;
- Support edge planning (buffering/hedgerows) around individual farms and around the ALR;
- Support initiatives to improve long term leasing opportunities for agriculture;
- Consider options for improving agricultural irrigation water productivity (eg drip irrigation);
- Encourage and support organic farming practices and ecological stewardship;
- Encourage the most efficient use of ground and surface water possible;
- Educate the public on the control of invasive and noxious weeds, such as Tansy ragwort, gorse and Scotch broom;
- Support initiatives for opportunities for small farmers to increase and diversify incomes through value-added products, agricultural services, and on-farm processing;
- Support Vancouver Island University’s proposed Agriculture Resource and Innovation Centre as a vehicle for the provision of education and extension services to Vancouver Island farmers.
RECREATION
Context
Metchosin has many parks, trails and green spaces that provide recreational opportunities for its residents and the CRD in general. Many people use Witty’s Lagoon, Taylor Beach, Devonian Park, and Matheson and Blinkhorn Lake parks for swimming, sunbathing, hiking, and other recreational pursuits. The Galloping Goose Trail is used for cycling, horseback riding, hiking, and commuting. Sections 25, 28 and 95, provincial crown land parcels, are used primarily by their adjacent neighbourhoods for nature hikes and horseback riding. A network of non-roadside trails have been developed during the subdivision process that allow safe horseback and hiking opportunities, connecting neighbourhoods to neighbourhoods. In 2009 council approved the Trails Network Master Plan which provides direction to planners and council on development of priority trails. As well there is a municipal tennis court, bike jump park and cricket field.
The Metchosin School ground is used as a day camp in summer months, Westmont school has a playing field, Hans Helgeson school has a playground. The Community Hall is rented for exercise classes and a badminton club. Hans Helgeson and other schools have gymnasiums and raised theatre facilities that could potentially be accessed by community groups. All these amenities can help to reduce carbon emissions by providing recreational opportunities within Metchosin.
Despite all of the above, most of the facilities in Metchosin are under-used by Metchosin residents.
The district also contributes financially to the Westshore Parks and Recreation Society (WSPRS) facilities.
Issues:
- Most children and parents leave the community and drive long distances to be involved in sporting activities;
- Under-use of local recreational amenities.
Recommendations:
Metchosin residents have many opportunities to enjoy recreational activities at home instead of traveling to other municipalities. Some ways to increase these opportunities are:
- Encourage the use of Metchosin sports facilities by promoting more participation by Metchosin residents (e.g. cricket field, tennis court, riding rink and dirt jump park);
- Encourage partnerships with the YM/WCA-Camp Thunderbird, the Boys and Girls Club-Metchosin Wilderness Camp, local schools, Pearson College and other appropriate organizations, for expansion of the use of their facilities to Metchosin residents;
- Consider a partnership to develop an all-weather playing field and to promote the expanded use of the cricket field.
ENERGY and GREENHOUSE GAS EMISSIONS
By becoming a signatory to the Climate Action Charter, Metchosin has committed to the following goals:
- being carbon neutral which respect to municipal operations by 2012;
- measuring and reporting on the District’s GHG emissions; and
- Metchosin specifically declared that we are not in favour of densifying, which is the impact of a complete, compact community.
The province prepared Community Energy and Emissions Inventories as a baseline to determine GHG emissions. Our total emissions for 2007 were measured at 23,395 tons/yr; of this total 84% was from transportation, 13.8% was from buildings and 2.2% from solid waste. The municipal staff and residents of Metchosin must work together to achieve these goals.
In the spring of 2010, the District updated the OCP by adding the following objective:
“To mitigate detrimental impacts of climate change, and to reduce community greenhouse gas emissions by 33% over 2007 levels by 2020.”
To address our commitments under the Climate Action Charter, Metchosin needs to reduce the amount of GHGs emitted, and increase (or at least maintain) the amount of GHGs that plants pull out of the air (sequester).
The three chapters in this section provide suggestions about how we might reduce GHG emissions from our three major contributors of GHG: transportation, buildings and solid waste.
- TRANSPORTATION
Context
According to the province, motorized transportation is the largest source of greenhouse gas emissions in Metchosin. Any meaningful effort to reduce greenhouse gas emissions in Metchosin has no choice but to address transportation and the way people use their vehicles. Transport hits the core of our lifestyles. The geographic and infrastructure layout of Metchosin further compound a complex issue. There are no simple solutions.
Sustainable transportation refers to human behaviour, as well as the use of appropriate technology. The objective is to consider not only non-polluting and greener transport choices, regardless of means and technology used, but also individual and social encouragement to promote these choices.
Metchosin bylaws already allow home based businesses on all properties, which can reduce the carbon emissions that incur from commuting. According to the 2006 census data, 12.4% of Metchosin residents worked from home.
Electric vehicle use is emerging as an energy friendly alternative to conventional gas powered vehicles, especially for short commutes
The District supports regional planning on transportation that includes the use of light rail transit.
Issues:
- Reluctance on the part of residents to use public transportation. Council has successfully worked with BC Transit in establishing a Park-and-Ride at St. Mary the Incarnation Anglican Church on Metchosin Rd, but use of the Park-and-Ride service is below expectations;
- Lack of safe cycling and pedestrian infrastructure along roadways. In 2009 Metchosin completed a Trail Network Master Plan that identifies and prioritizes a future trail network for the district that can guide decisions made by future councils, so that the municipality may continue to develop pedestrian/bike/horse trails adjacent to municipal roads as they are built or being reconstructed. The primary purpose of such trails is to provide non-motorized commuting and recreational alternatives but due to the time frame to develop these this may not make a significant difference to our GHG emissions by 2020.
- Lack of facilities to recharge electric vehicles;
- Air pollution from idling vehicles. The worst mileage a vehicle can get is 0 miles per gallon, which occurs when it idles;
- Municipal vehicles, which currently all use diesel or gas, and their carbon footprint.
Recommendations:
Transportation is cited as the leading cause of Metchosin’s green house gas (GHG) emissions. In order to reduce the District’s GHG emissions, it is important to improve access to public transportation and to overcome the community’s reluctance to use it. The following actions will help:
- Continue to improve the availability of public transportation, bus shelters, secure bike storage, park & rides and carpooling by liaising with BC Transit and promote these travel options through public education;
- Continue to improve pedestrian and non-motorized corridors (trails) by constructing bike lanes and trails where applicable and when funding permits;
- Encourage and support a vehicle sharing co-op;
- Consider the environmental standards of any vehicle purchased by the municipality and make purchases that best support the municipal objectives and the environment;
- Review road design standards for municipal roads to ensure that they are in keeping with the character of the District, that they minimize environmental degradation and the potential for erosion, that they foster traffic safety and that they permit the safe and proper access for emergency and road maintenance vehicles;
- As technology and funding opportunities become available, facilitate the establishment of an electric vehicle recharging station in the village centre.
- BUILT STRUCTURES (including Residential)
Context
Canadians use more energy per person than all other countries in the world except for Iceland and Luxemburg – in fact, we use 2.5 times more energy per person than the average of all developed countries. In 1960, Canadians used 4251 Kg of oil equivalent per capita; by 2007 the amount had risen to 8169 kg per capita. By comparison residents of the United States used 5642 kg. and 7766 kg per capita, respectively, with U.S. consumption peaking in 1978 and decreasing steadily since. British Columbians used 0.24 TeraJoules of energy per person in 2003, a decline of 8% from the 1990 rate of 0.26 TJ. Canada at large is currently falling further behind the United States in terms of renewable energy, and energy efficiency initiatives. U.S. per capita expenditures are currently running at about 18:1, and 2:1, respectively, over those in Canada.
Sustainable and resilient building within Metchosin includes the actual structures, total energy and water use, total resource use, land use planning, ecological connectivity, affordable housing, demographics, community building, and education. All of these relate either directly or indirectly to GHG emissions, carbon use, and rising costs of fossil fuels.
All topics are intimately interconnected and must be considered as a whole rather than piecemeal. The human built environment impacts total green house gas emissions on several levels. There is scope to improve our energy and resource consumption patterns.
Metchosin has always been a leader in promoting and protecting the rural and natural values of the community. The District, with its innovative approach to maintaining these values and fiscal prudence, can continue to act as a highly effective catalyst in the quest to conserve energy and to reduce consumption.
Issues:
- Climate change predictions forecast wetter winters and drier summers and more extreme weather events at greater frequency. New infrastructure and zoning will need to adapt to these challenges.
- Development results in a loss of biodiversity and reduced carbon sequestration;
- Some residents live in relatively large, energy inefficient houses and consume significant quantities of goods. After transportation, our energy and resource consumption is our 2nd largest source of carbon dioxide (CO2) emissions;
- Some residents are not aware of their carbon footprint;
- The manufacture and transport of building materials for built-up infrastructure increases the carbon footprint of the community;
- The life cycle of a building usually results in an accumulating carbon footprint (heating, lighting and consumption);
- Without public education and encouragement for residents to upgrade their homes, existing homes will continue to have a significant impact on GHG emissions;
- Occasionally, senior governments offer incentives to reduce GHG emissions and replace energy inefficient devices and products (appendices 3,4); these incentives can be difficult to find, and the products difficult to assess;
- The fast pace at which technologies are being developed often makes it difficult for District decision makers and homeowners to be aware of the most efficient and financially prudent choices for reducing GHG emissions;
- Adoption of energy efficient technologies can be initially expensive and deter homeowners from implementing energy efficient strategies;
- Current regulations for residential sewage systems and septic fields require flush toilets which account for 30% of domestic water consumption, loss of habitat, and loss of resources. Transport of septic wastes out of the community (from pump-outs) results in a further source of GHGs.
- Agricultural land is a scarce and valuable resource, it is important to consider ways to reduce the footprint of buildings and non-food producing activities on agricultural lands.
Recommendations:
The District has committed to reducing GHG emissions over 2007 levels by 33% by 2020. Buildings account for 13.8% of emissions. The provincial government has authority over the building code. Lobbying the province for changes which will enable greener buildings will help reduce emissions. Additional ways to achieve this are:
- Consider land use decisions, as appropriate for Metchosin, based on changes in, and projections of, groundwater and aquifer levels, snow loads, extreme rain and droughts, greater storm surges along the shoreline. Revise snow load requirements, road drainage plans, floodplain and shoreline regulations and locally-adapted fire smart guidelines as needed;
- Continue to assess bridges, septic systems and new infrastructure in floodplains using 100-200 year flood projections;
- Lobby the province for changes to the Building Code that allow for greener building practices (e.g. greywater reuse systems, composting toilets);
- Require all new construction to have minimal environmental impact, including minimizing GHG emissions;
- Encourage policies promoting building methods that have minimal impact on ecosystems and landscape;
- Continue to encourage building practices that minimize or offset the loss of pervious surfaces (see District Rainwater Management bylaw);
- Allow other green building policies that can be demonstrated to meet the functions and safety objectives of the building code while protecting the interests of future owners, such as green roofs, night sky friendly lighting, etc.;
- Post a personal carbon footprint calculator on the District website;
- Post information on the District website about the latest technological innovations on energy use reduction strategies (e.g., see appendix 5);
- Post government sponsored homeowner initiatives for carbon footprint and energy use reduction on the district website with links to Energy Canada (http://oee.nrcan.gc.ca/english/), LiveSmart BC (http://www.livesmartbc.ca/), BC Hydro (http://www.bchydro.com/), and BC Sustainable Living (http://www.bcsea.org/solutions) websites (see appendices 3, 4);
- Investigate ways in which the District might help residents with renewable energy installations and energy efficiency improvements costs, and consider the concept of Local Improvement Charges;
- Provide education on, and encourage, building upgrades regarding energy and water use, such as low flush or composting toilets, energy and water efficient appliances, rainwater storage, green roof, low emission windows, heat recovery systems including ground loop energy systems and solar electric and solar thermal energy systems;
- Encourage building new structures to have net zero energy and water impact;
- Encourage home energy audits, a first step to help inform home and business owners on their options when considering energy efficiency upgrades (such as sealing window and door drafts);
- Develop relevant plans regarding emergency management to take into account increased forest fire risk, flooding, and wind, rain and snow storms;
- Consider methods to reduce the footprint of buildings and non-food producing activities on agricultural land (eg encourage compact homes, shops, barns) and that the house, accessory building(s) and storage (parking) footprint does not affect agricultural production and viability.
- SOLID WASTE
Context
Metchosin is, for the most part, a residential and agricultural community. Commercial and industrial land uses are small enough not to detract from the overall character of the District.
All developed properties in Metchosin have septic systems to accommodate liquid waste. Septic systems are effective in treating liquid waste when they are designed, installed, and maintained properly. However, it is estimated that 20% of systems in the CRD are failing. Failing septic systems result in significant public health risks and environmental degradation. Specifically, they cause contamination of groundwater and local streams, rivers, and lakes, as well as contamination of shellfish beds and the nutrient enrichment of sensitive water bodies. Contamination of groundwater is a serious issue in Metchosin because approximately 60% of residents draw their drinking water from wells.
Under the Provincial Sewerage System Regulation, owners of systems installed after May 31, 2005 are required to follow their prescribed maintenance plan and keep all records of maintenance. Where Building Permits are required (i.e., new construction), septic designs are routinely submitted to the District as a requirement of the Building Permit process and no Occupancy Permit is issued without a properly submitted and approved septic system design.
Solid wastes may be transported by a commercial contractor or in person to the CRD’s Hartland landfill site. The Hartland landfill site is filling, however, and to extend the life of the site, the CRD, together with member municipalities, is developing programs to divert solid wastes away from landfill and into other recycle streams. For example, Hartland no longer accepts waste construction materials. Some residents find disposal options too onerous and dispose of garbage and furniture, for example, adjacent to road sides.
The District finances a blue box program to collect paper, cardboard, metals, and some plastics for recycling. Some residents compost kitchen waste, but some store kitchen waste in receptacles that attract bears. Some residents burn wastes. Some private organizations take some electronic goods for recycling. Many residents use a combination of all of these disposal methods. The District has recently become part of a provincially-sponsored program to collect batteries and cell phones.
The District allows open burning and incinerators from October through April, if weather conditions permit.
Issues:
- Waste management issues reflect the spectrum of waste disposal methods available to Metchosin residents;
- Septic systems no longer operating effectively, or too small to accommodate demand, may contaminate surface and groundwater sources;
- Increasing constraints on regional landfill mean more and more waste will not be accepted for disposal at the Hartland Landfill site;
- While composting alternatives are used by some residents, composting alternatives are poorly understood by some residents and are therefore not used or not used correctly;
- Garbage and items such as used furniture and mattresses are from time to time disposed of by depositing them along road sides or on private property;
- Burning of household garbage contravenes bylaws but is nonetheless adopted as an effective means of disposing of some garbage;
- Storage of household waste in garbage receptacles that entice bears into residential neighbourhoods and account for approximately 60% of complaints about bears. Bears adapted to residential foraging may present major safety issues;
- Metchosin allows open fires throughout most of the fall, winter and into the spring. Burning releases carbon into the atmosphere and the particulate matter released can adversely affect the health of people with respiratory sensitivities.
Recommendations:
Metchosin residents are responsible for the disposal of septic wastes. The CRD has a well used recycling system in place, which is continually undergoing innovative change. Further suggestions for the District are:
- Encourage the use of techniques which separate greywater from other sources of liquid waste so that greywater can be stored and used for irrigation (excluding irrigation of crops for human consumption);
- Lobby for changes to building and plumbing codes to permit the reuse of greywater and composting toilets;
- Encourage residents to maintain their septic systems to proper functioning condition and make information about proper septic system construction and maintenance available to Metchosin residents;
- Consider the development of a municipal compost yard;
- Encourage residents to adopt practices to contain household and kitchen garbage in secure, bear-proof receptacles.
APPENDIX 1: Metchosin’s Community Energy and Greenhouse Gas Emissions Inventory: 2007
Appendix 2: Mitigating and Adapting to Climate Change through the Conservation of Nature
Appendix 3: Examples of Canadian Grant Initiatives
- Canadian Mortgage and Housing Corporation (CMHC) has added environmentally friendly features to the Mortgage Loan Insurance it offers. If the homeowner uses CMHC insured financing to buy an energy-efficient home, purchase a house and make energy-saving renovations, or renovate an existing home to make it more energy-efficient, a 10% refund on the Mortgage Loan Insurance premium may be available. Homeowners may also have the added flexibility of an extended amortization (up to a maximum of 35 years) without a premium surcharge.
- The BC government re-opened the LiveSmart BC home energy rebate program for new participants starting April 1, 2010. This program grants BC homeowners rebates of up to $5,000 and more for home energy improvements. To qualify a home energy audit is required before the upgrade begins.
3. Financial Institution Initiatives
1.o RBC Energy Saver™ Loan – Make a qualifying environmentally-friendly purchase and receive a 1% discount or a $100 home energy audit rebate on a fixed rate installment loan over $5,000
o VanCity Bright Ideas home financing. This personal loan is at prime+1 rate for up to ten years. The low interest rate saves money compared to a conventional loan. Borrow as little as $3,500 or a maximum of $20,000. Pay it back with regular monthly payments.
Murdock, T. 2009. Climate model projections and anticipated impacts for Southern Vancouver Island. Pacific Climate Impacts Consortium. and University of Victoria.
Penn, Briony. 2010. Conservation offsets. A Revenue toll to conserve natural areas, watersheds and community resilience. Land Trust Alliance, British Columbia.
Pidgeon, Emily. 2009. Carbon sequestration by coastal marine habitats: Important missing sinks. The Management of Natural Coastal Carbon Sinks. IUCN.
Resilience Alliance. 2009. Assessing and managing resilience in social-ecological systems: A practitioner’s workbook, Version 1.0. [online] URL: http://wiki.resalliance.org/index.php/Main_Page.
Trofymow, J.A., G. Stinson, and W. Kurz. 2008. Derivation of a spatially explicit 86-year retrospective carbon budget for a landscape undergoing conversion from old-growth to managed forests on Vancouver Island, BC. Forest Ecology and Management 256: 1677-1691.
Affordable Warmth BC.
Canada Energy Profile: U.S. Energy Information Administration. Independent Statistics and Analysis
Canada Mortgage and Housing Corporation; Energy-Efficient Housing Made More Affordable with Mortgage Loan Insurance.
Keith, Heather, B. G Mackey, and D. B Lindenmayer. Re-evaluation of forest biomass carbon stocks and lessons from the world’s most carbon-dense forests. PNAS July 14, 2009 vol. 106 no. 28
Live Smart BC. – http://www.livesmartbc.ca/homes/h_rebates.html
/E:/Users/Bhall/AppData/Local/Microsoft/Windows/Temporary Internet Files/Content.Outlook/Documents and Settings/jmacpherson.WS04/Local Settings/Temporary Internet Files/Content.IE5/Y1DZXAQS/%E2%80%A2%09Live Smart BC. http:/-www.livesmartbc.ca-homes-h_rebates.html)
Engineering Services 9th Floor, City Hall 50 Centre Street South, Oshawa, Ontario, L1H 3Z7
Official Community Plan, 1995. http://www.district.metchosin.bc.ca/siteengine/activepage.asp?PageID=33
Using Local Improvement Charges to Finance Energy Efficiency Improvements: Applicability Across Canada
Wilson, Sara, J. and R. J. Hebda, 2008. Mitigating and Adapting to Climate Change through the Conservation of Nature in British Columbia.