The fiollowing set of lab reports were done as an exercise by the marine environmental systems class in September 1997
ENVIRONMENTAL SYSTEM CLASS ASSIGNMENT : SEPTEMBER 1997
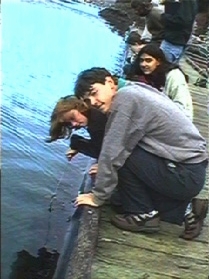
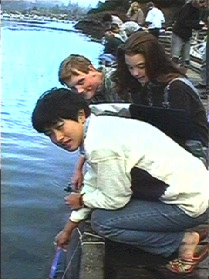
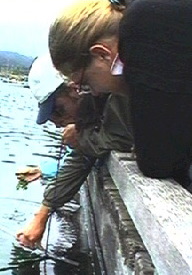
For the first assignment of the year, the first year environmental systems classes were given the task of working in groups to examine different one meter sections of the dock skirt at Lester Pearson College. This was their first experience in using html as a word processing and presentation media, and the following presentations represents their first draft.
A COPY OF THE FIELD-LAB WORKSHEET:
THE “FOULING SYSTEM”
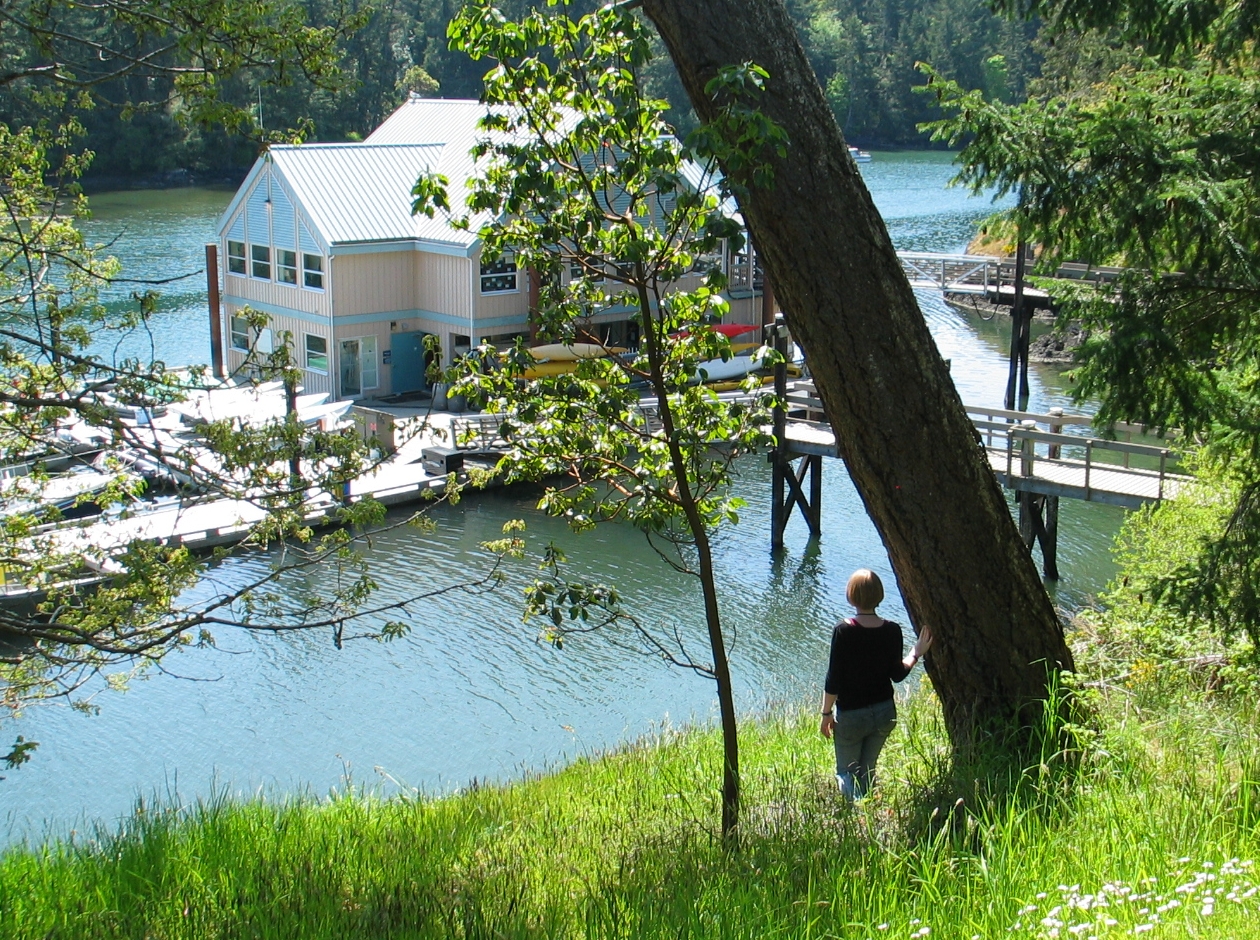
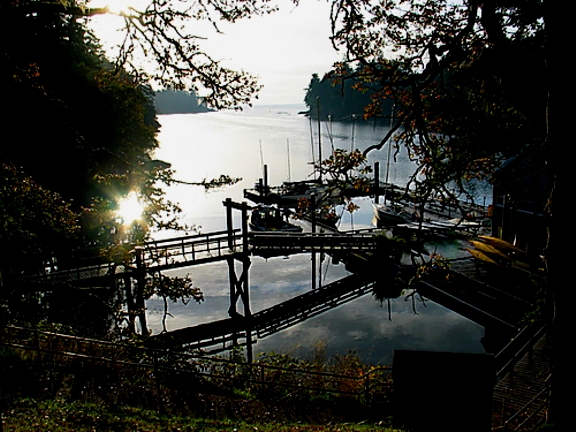
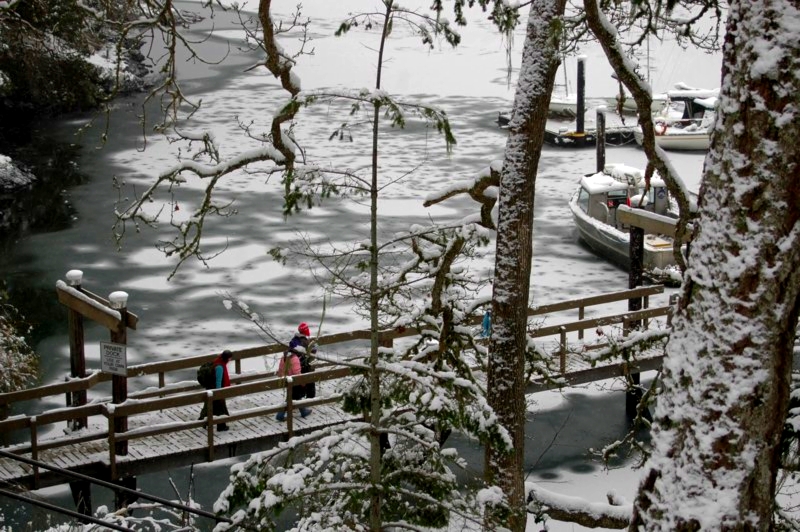
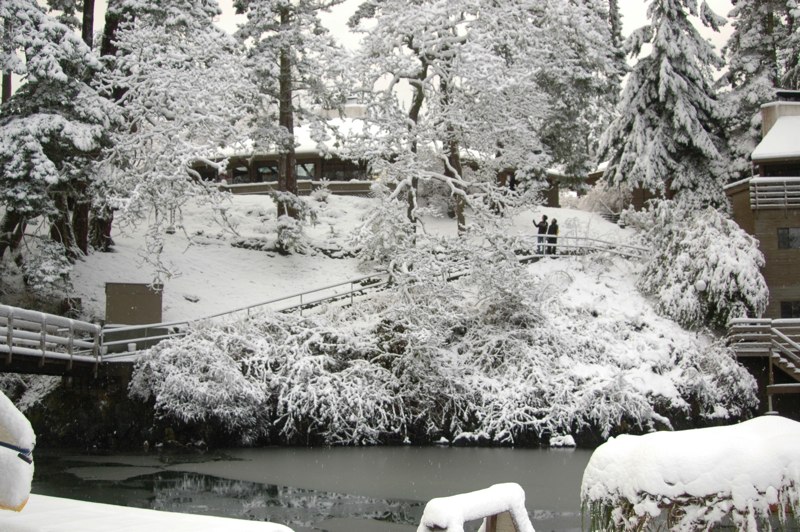
PEARSON COLLEGE DOCKS IN PEDDER BAY
ENVIRONMENTAL SYSTEMS FIRST YEAR FIELD LAB
INTRODUCTION:
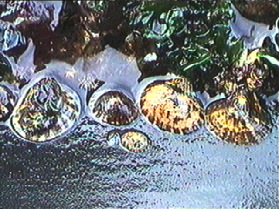
You will be shown a section of the protective rubber skirt hanging from the Pearson College docks. On the bullrail of the dock you will find lettered sections of 1 meter. Growing on the rubber you will find a community of organisms which lives in this unique location . On this first introductory lab, we want you to use this set of organisms to gain a better understanding of the structure and function of ecosystems.
TOOLS YOU WILL USE:
Reference: Odum- ECOLOGY and Our Endangered Life Support System page 38-58)
Identification Manuals,
Adobe PageMill Software, Power MacIntosh Computer
OBJECTIVES:
After doing this lab you will be able to:
A) Model using Odum’s Symbols the material; cycles and energy flow of the Pedder Bay fouling system represented on your section of dock skirt. (Page 40-41 Odum- ECOLOGY and Our Endangered Life Support System)
B) Define the boundary of your system.
C) Identify the Structural components of the system:
1) Biotic:
Horizontal distribution aspects- regular, clumped, random, etc.
Vertical Distribution of organisms- stratified- (depth),
Biodiversity of the organisms
2) Abiotic:
Temperature, light-Intensity and Quality, Nutrients, Wave Action, tidal height, Salinity, etc.
D) Identify the Functional Components of the system:
1) Energy Flows- Producers, Consumers, Decomposers, Trophic Levels
2) Material Cycles: ( Biogeochemical Cycles) -Nitrogen, Phosphorous, Carbon, etc.
3) Succession – Temporal and Spatial.
E) Prepare a web-ready page representing the process and findings of this study.
F) Discuss the ways that humans might have an impact on this system.
G) Quantify the populations of the community , (using density and frequency measures)
PROCEDURE:
1. You will work in four groups for this field lab. Special effort should be made to include all members of the group. Decide on a recorder for the group. The end product will be one electronic lab report for each group, made up of the contributions of all.
2. Use the references available and discussion with the teacher to establish a name for the major players in the system.
3. Examine the section of dock skirt assigned to your group. Describe the populations qualitatively and quantitatively .
4. You will be supplied with some tools to measure some of the abiotic factors in the area, Record the change of at least one of those factors over some predetermined unit of time. (a temporal aspect)
5. Produce a full page diagram model of the system being studied using the appropriate Odum symbols. Use different colors to represent energy flow and material cycles.
6. Prepare a web-ready document on the lab, link in photographs done with the video camera. Indicate to the teacher when you have decided which shots you want.
7. Open a glossary file ( Create it in the program EXCEL) on the computers to record new words encountered in this lab. Where you can translate into your own language, make that addition in a column.
OPEN ENDED SUGGESTIONS:
You may wish to work on a few more challenging ideas once you have understood the basics. The following could be done individually or by the group.
1. Is what you see happening here the same 24 hours a day? How can this be included in your model?
2. Can you devise a method to quantify wave action? How significant is it as an abiotic factor?
3. How fast does recolonization or succession take place here in the bay, and what steps does it go through in the process. Could a small scale experiment be set up to monitor this?
4. What is the diversity index of the organisms here ( use Simpson’s Diversity Index)
5. Further work will be done on the plankton of Pedder Bay later on. Is there anything you could do at this point to quantify these important organisms? Is the plankton composition constant from day to day (temporal aspects).
6. Prepare a “Case Study” of one of the organisms in this system. Life cycles- growth rates etc.
7. Design a pyramid of biomass for the system. (This would entail wet or dry weights of the organisms of each trophic level.)
September 1997, Environmental Systems
Garry .Fletcher:. Lester B. Pearson College
STUDENT PAGES
Sophie Desoulieres, Fiona Talbot-Strong, Tamas Vonyo.
 Tubeworms Anonymous
The rain was dripping on us as we embarked on our most difficult task of staring at stuff on a rubber skirt attached to the dock on our beautiful campus. Being generally good-natured, we pressed on regardless.
 Purpose of the field lab: To observe the unique biodiversity that can be found on a rubber skirt.
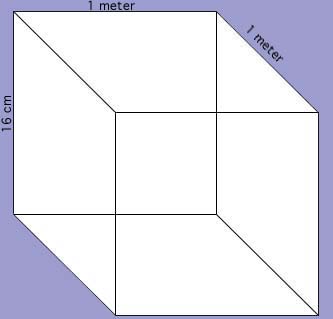
Procedure: We looked at the plant and animal life present, learning their names and functions within our system, and measured both the air and water temperatures within that system. We decided the boundaries of our system, i.e. 25 cm deep, one metre long, and one metre from the dock. This being said, we kept in mind that the surrounding area directly affects our system.
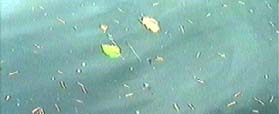
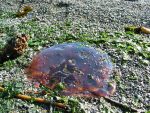
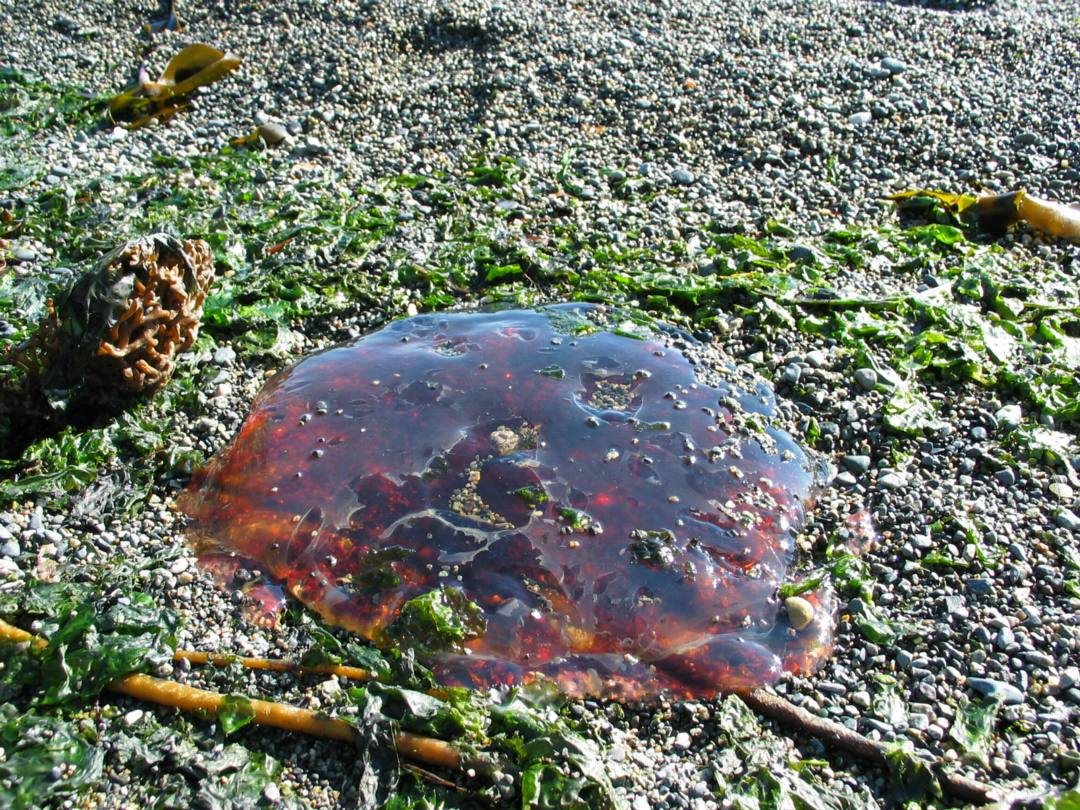
tube worms, pink sponge, yellow sponge, limpets, mussels, ulva, school of anchovies, jelly fish, obelia, phytoplankton. The amount of plankton was such that one could see 3.25 metres towards the ocean floor.
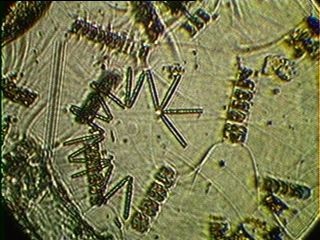
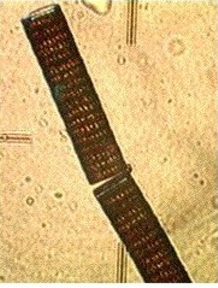
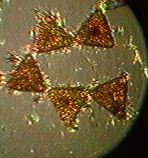
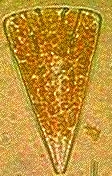
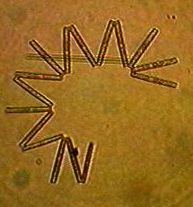
Producers: Ulva, phytoplankton, diatoms
Primary consumers: anchovies, limpets,
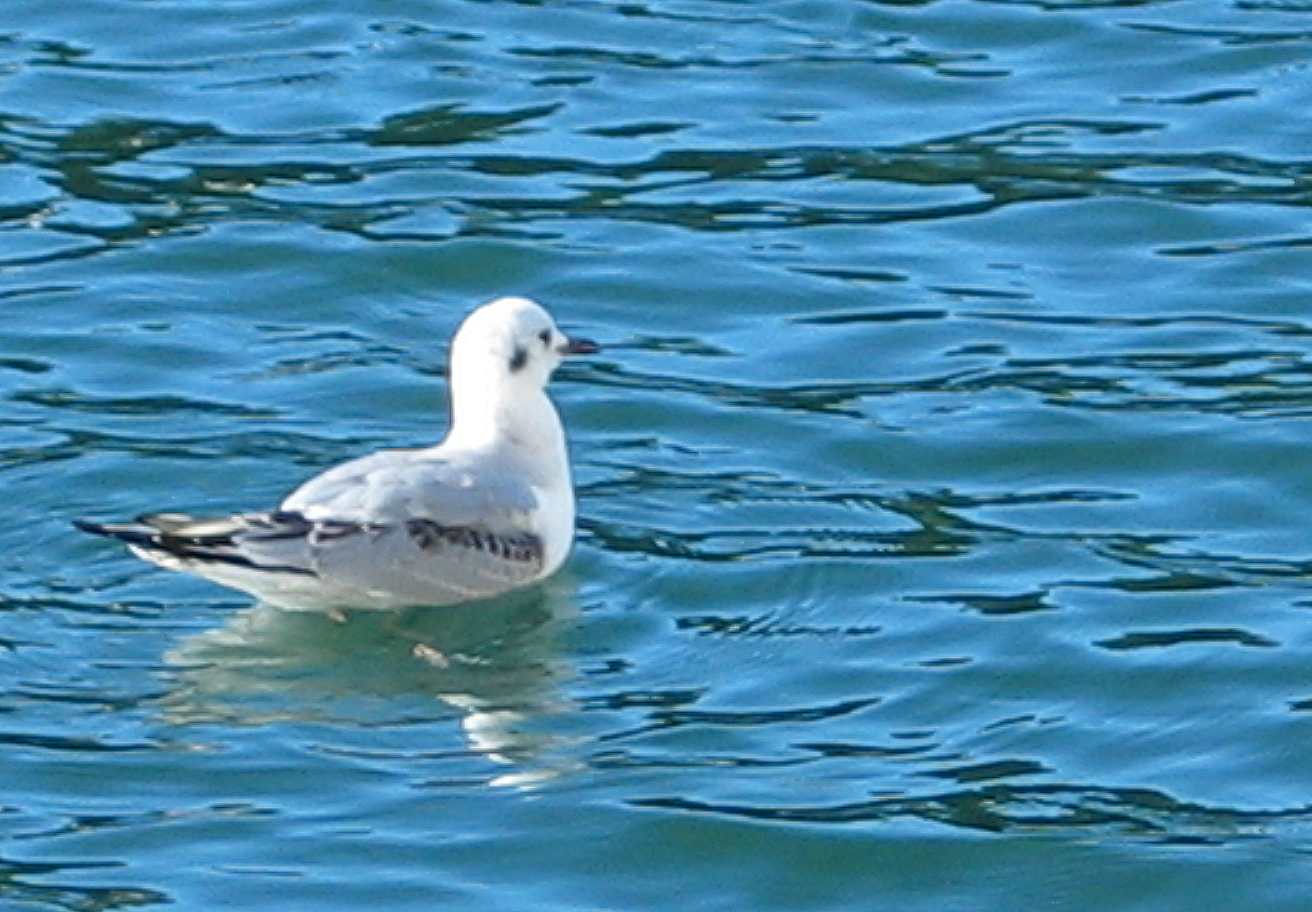
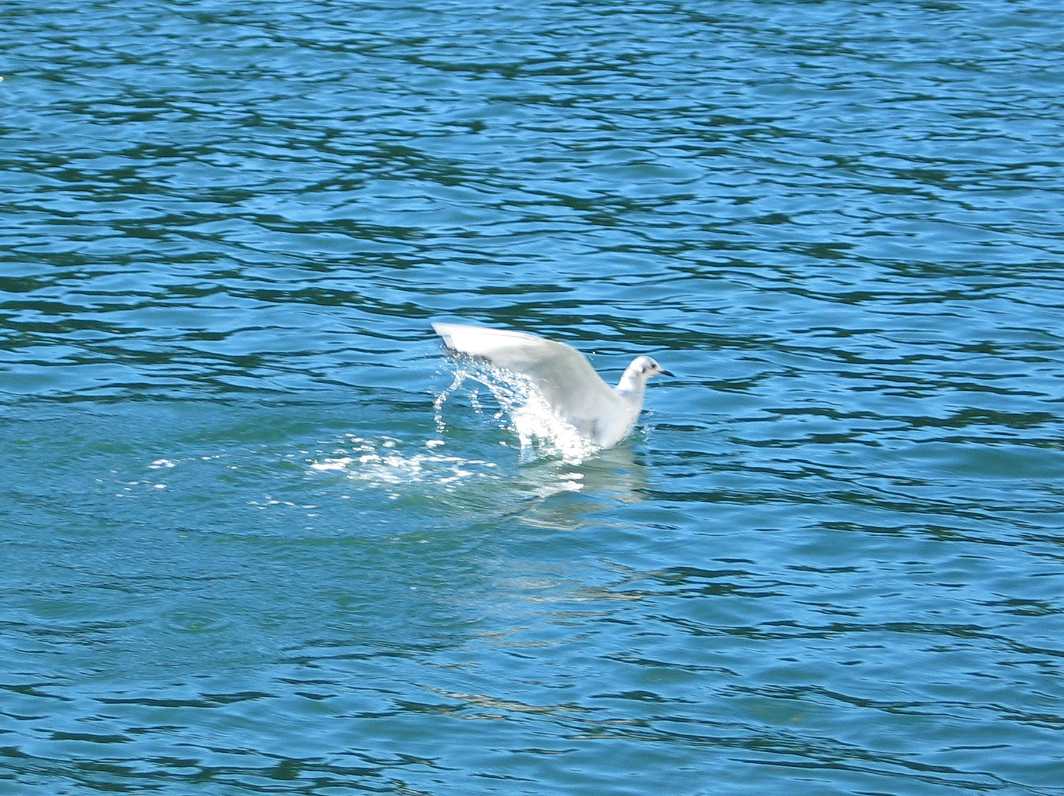
Secondary consumers: salmon, seagulls ( In general seagulls eat salmon, which makes them tertiary consumers too. )
Abiotic factors:
Temperature: 10.1 C ; Salinity: 27 ppt (parts per thousand)
The salinity rate of the water in Pedder Bay is lower than the one of the Pacific Ocean ( 36 ppt ) As Pedder Bay is in an estuary ( fresh and sea water ).Wave action: There were 5 waves ( about 30cm high ), when a boat passed. We noticed that there were less plankton when we made our measure with the Secchi disc.
===============================================
Forrest Pass , Eri Akamatsu, Kelly Bowen
 On September 16, 1997, we went down onto the docks of Pedder Bay to study the marine ecosystem. We took note of the various species of creatures living on the rubber skirt surrounding the dock. We observed that there are many factors affecting the ecosystem, both biotic and abiotic.
Purpose of the Field Lab:
The purpose of the field lab was to formulate a model of the marine ecosystem on the rubber skirt around the college dock.
PROCEDURE:
To begin, we went to the docks and took note of the various creatures we saw on our rubber skirt. We also recorded the factors within our three cubic metre marine system.
 Species List:
-Barnacles
-Mussels
-Ulva (Green Algae)
-Limpets
-Seaweeds
-Halochondria (Yellow Sponge)
 -Red Filamentous Algae
-Obelia (Something Whitish)
-Isopods
-Little Fish
-Gulls
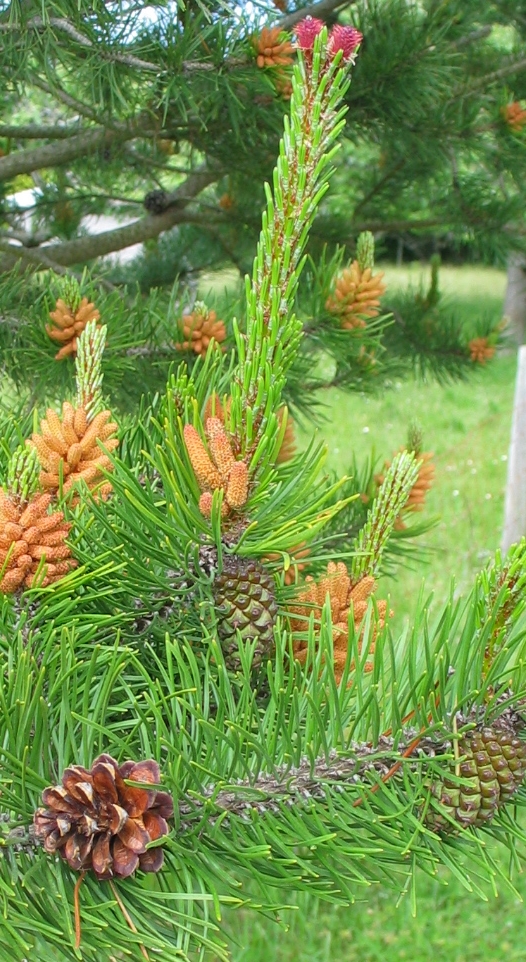
-Douglas Fir Needle
-Ocean Spray
-Leaves
-Boats (wake and oil residue)
-Guano (contains nitrogen and phosphates)
OBSERVATIONS:
During this lab, we observed the interaction of several marine species. In addition to observing organisms feeding on other organisms (ie: barnacles on plankton, harbour seals on herring or anchovies), we also observed organisms involved in symbiotic relationships. For example, we observed barnacles anchored to limpets. The relationship results in mutual benefit as (a) the barnacles are able to anchor themselves, alleviating problems that could result from “swimming free”, and (b) the barnacles help to discourage predators that could potentially prey on the limpets. There are several other biotic factors that affect the system, including “guano” produced by seagulls that, as it contains phosphates and nitrogen, helps to maintain the balance of nutrients within the system.
We also observed numerous abiotic factors that could , and in all likelihood do, affect the lives of the living organisms. These include the temperature of the water, a factor that helps to determine which organisms can survive in the system; the amount of sunlight to which the system is exposed, a factor which affects the plankton, algae, and seaweed populations; and the salinity of the seawater. Human activity also plays an important role in the system. The wake from boats, pollutants from human sources, and the number of fish caught by commercial fishing fleets and recreational anglers all affect the processes of the system.
It is unlikely that the processes within the system are constant. Seasonal disparities in sunlight, temperature, and animal and human population in and around the system indubitably affect the many of the qualities of the system. For example, a sudden rise in the seagull population could upset the delicate nutrient balance in the system. This sudden change, coupled with favourable amounts of sunlight and warm temperatures, would precipitate a large algae “bloom”. The rise in the seagull population could be a direct result of a drop in the seal population, thus eliminating competition between the two species over their common food source: fish. The decline in the seal population, in turn, could be the result of human economic factors: pollution from seaside industrial projects, or the massacre of seals resulting by fisherman angered by low salmon returns. Thus, abiotic factors that fluctuate throughout the year have a profound impact on the processes of the system and, by extension, on the organisms therein.
Visibility is an indicator of light penetration and is, therefore, an important quantifiable abiotic factor. One uses a Secchi dish to quantify visibility; on September 19, 1997, the Secchi dish was visible to a depth of 3.5 metres. However, in winter, this figure would increase because of the lack of plankton and algae in the frigid water. Human activity on the periphery of the systemwould also have an effect on the visibility; fertilizers carried in runoff from seaside farms could upset the nutrient balance of the system, perhaps creating an algae “bloom” (decreased visibility), while large falls of “acid rain” could adversely affect the pH level within the system, killing off the algae/plankton. The second scenario has occurred in parts of Ontario, creating lakes that are “crystal clear”.
The action of waves and tides have an effect on the system and its member organisms. Tides and waves “flush out” the system, thus helping to maintain the nutrient levels necessary for the survival of organisms within the system. Without tide and wave action, the water in the system would become stagnant. Nutrients, such as nitrogen, would accumulate in the stagnant water, fertilizing algae and other marine plants. While tide action is fairly easy to quantify, the quantification of wave action poses a challenge. One could determine the regularity of waves by counting the number of waves the pass a certain point in an hour (day, month, year) and divide by the number of minutes (hours, days, months) to derive an average. It could also be useful to determine the average height of waves passing a point, or the force with which these waves strike a dock. These would all aid in the quantification of wave action.
Forrest, Eri, Kelly
=============================================
Sara Pavan, Giovanni Rosso, Sebastian Ferrero:
 For this lab we analysed the system contained in a section of the rubber skirt which protects our docks at Pedder Bay.
PURPOSE: To model the structure and function of the fouling system.
BIOTIC STRUCTURE:( Species List )
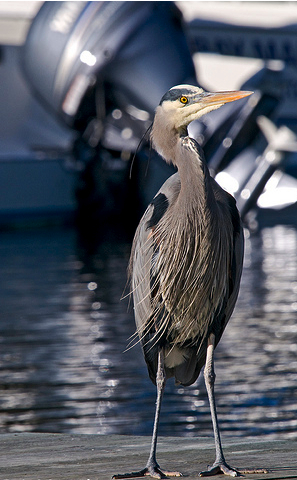
Polyorchis, Mussels,Isopod,Sea 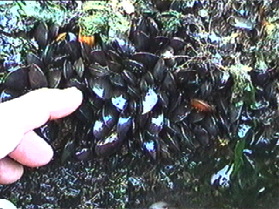 Squirt,Herring,Blue Heron,Cormorant,Harbour seal,Sea Gulls,Limpet
Materials: Thermometer, meter stick, and a spatula
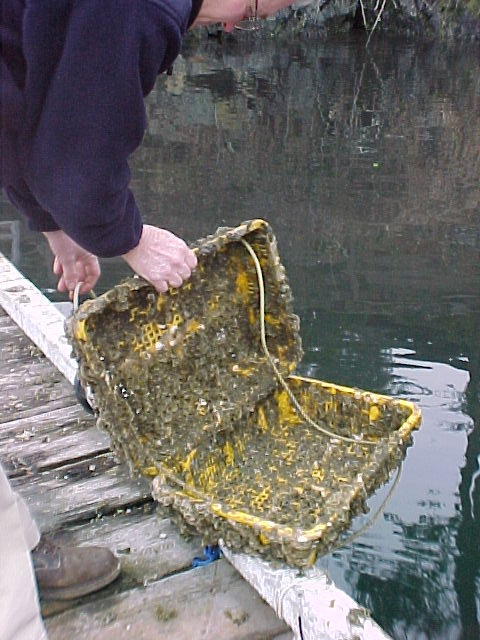
Boundary: Our system included the “I” section of the dock skirt. The environment we considered was 1m deep and ran to the opposite side of the bay. We determined this to be our boundary because it would include factors which influence our small section of the rubber skirt such as mammals, birds and human factors.
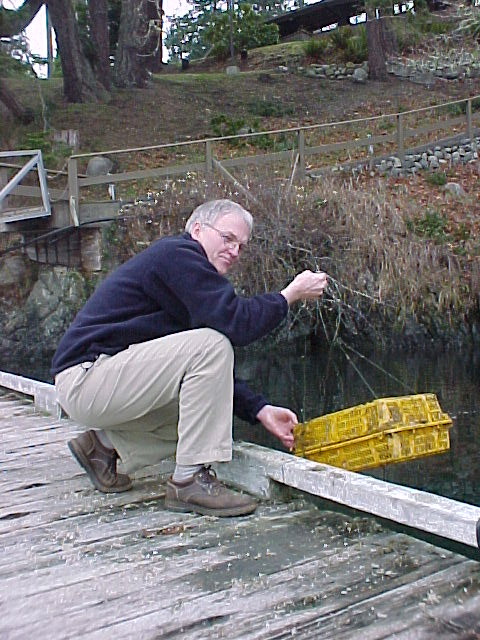
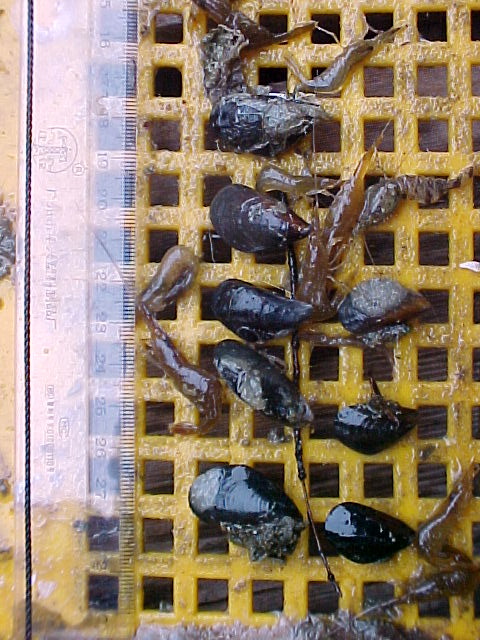
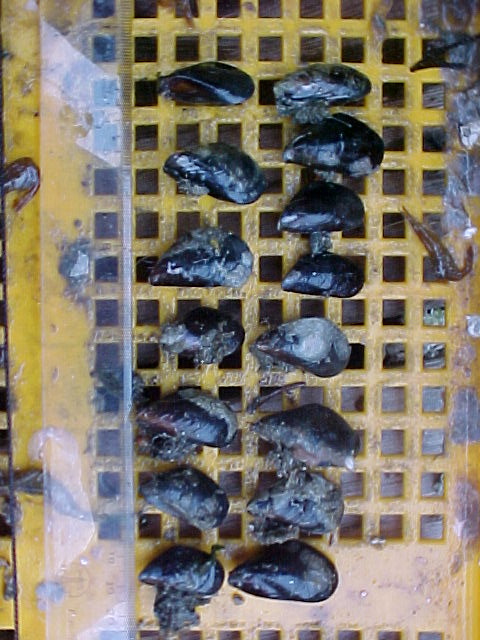
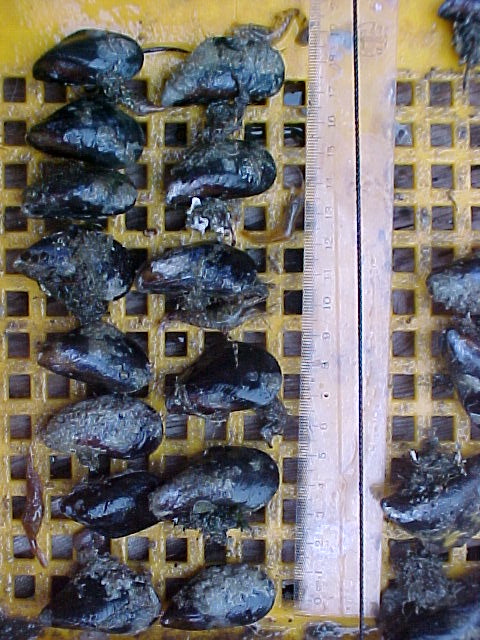
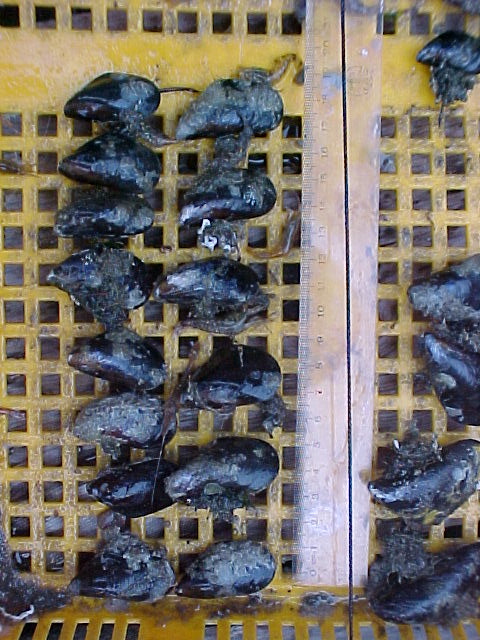
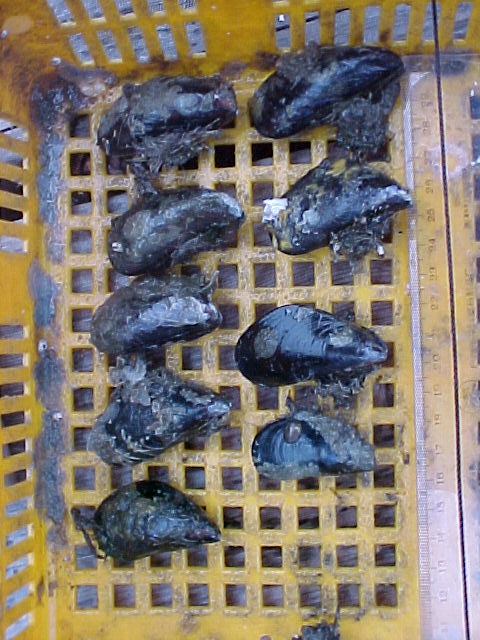
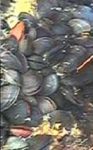
Distribution aspects: The most prosperous life forms in our system were the mussels. After taking several measurments in different parts of the skirt we found out that the average density is of about 28 mussels per 25 centimeters squared. These results lead us to the conclusion that there are more or less 1800 shells in the “I” section. They were clumped towards the bottom of the skirt with very few of them near to the surface.
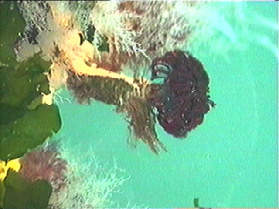
The sea squirts were clumped again around the bottom and were hidden between mussels. Numerous herring and even one polyorcas jellyfish migrated through our system.We sighted many birds entering our system to feed. The distribution was clumped- with a large concentration of lifeforms near the bottom of the rubber skirt, and far less organisms living at the top. Smaller organisms usually used the harder shell of the mussels as shelter and grew underneath them. The isopods in particular could usually find concealment under the cover of seaweed and mussels.
Abiotic: The temperature of the water was 12.5 degrees Celsius while the external temperature was 15 degrees. The light was brighter towards the top of the water. Nutrients in our system were provided by sun light , organic waste, and other materials brought in by the tide and other external factors. Because the tide changed often and fairly extremely, fewer organisms lived above the lowest sea level. It can be assumed that the ones which did were hardier and didn’t require an environment as stable as the ones living further under the water surface.
Docks by night: We also had a chance to observe the piece of skirt we observed during the night and we found out that several other species are apparent at that time. These were: shrimp (Two different species, which grasp on algea, shells and pieces of material also close to the sea level. We noticed that this behavior changes during windy evenings. In fact, they don’t come very near to the surface then, probably because until a certain depth the waves caused by the wind make it difficult for them to swim and grab materials.) ; clam worms (These invertebrates like to swim quite near to the surface especially around light sources); sculpins (These small fish like to search for food under the green algae beside the mussels) ; herring (These fish can also easily be seen during the day but at night they seem to be less active); small crabs (Some crabs appear near to the surface, but only small ones); fluorescent organisms (We never saw these organisms before. They look like small larvae and glow with a greenish light. They also like to swim near to light sources. The reddish brown striped shrimp seem to be slower but better protected by a larger thicker shell); seals (As almost all the organisms we listed above they are also far more daring at night when they come quite close to the docks.
Human impact: During the day the area around the docks is constantly crowded by boats which travel from the marina to the open sea and back. This causes both noise pollution and pollution of the water through oil, and waste products. Both these factors cause the animals to become more reticent during the day. Algae and shells don’t have the capability to react because they don’t have the ability to move but ” intelligent” animals such as seals, birds and fish often build a realtionship with human beings which permits them to find food easily. The best way in which people can operate in an environment is by respecting it and not trying to change the habits of the creatures that live inside it. Concluding we could say that as the number of human beings increases the density of animals who can’t move diminishes meanwhile the others can diminish , increase or remain the same as long as the new conditions are beneficial to them. Some animals might also be leaving during the day and coming back at night when the whole bay is more peaceful.
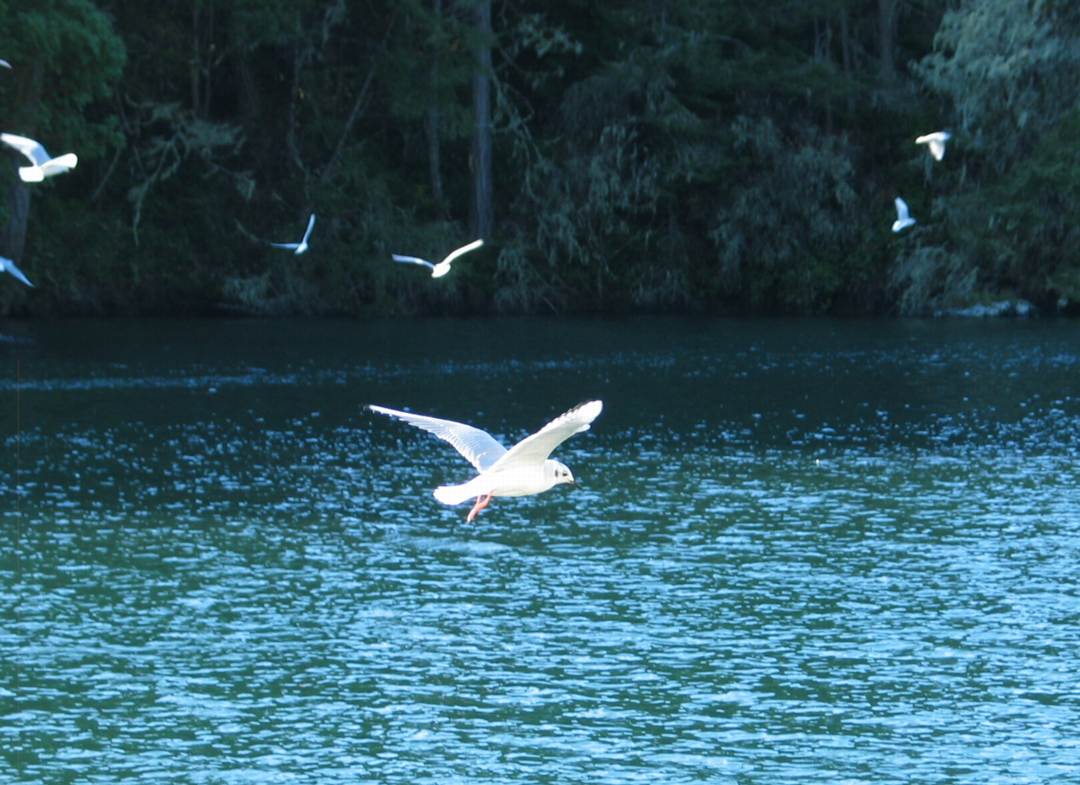
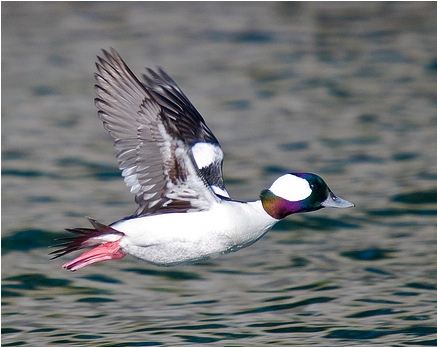
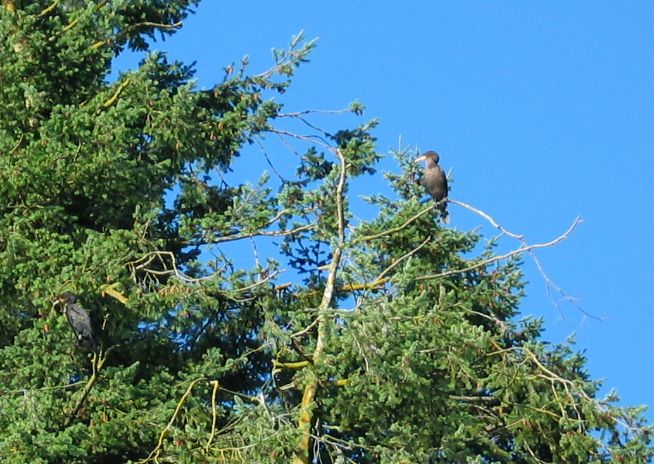
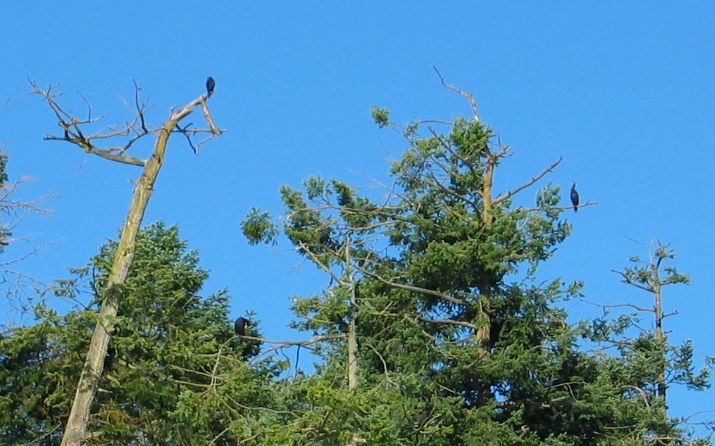
Density: We already have mentioned some of the density and distribution aspects of organisms living on the skirt before, but now we would like to spend a few words talking about animals which swim or fly around it : CORMORANTS ( These big black birds that have the habit of staying on the top branches, preferably if not covered by leaves, of high trees which grow near to the water usually gather in large groups until they haven’t covered the space they can use to sleep. In the bay they aren’t bigger of a dozen but at Race rocks, for example, the groups probably count hundreds of units.) ; SEALS ( These animals get near to the docks especially at night or during rainy days when the boat traffic is less intense and they aren’t normally more than two or three, but they don’t stay still in one place, instead they move around all over the place); KINGFISHERS ( These cute small birds are quite scared from human beings therefore they can normally be seen in the distance, mostly alone.); SEA GULLS ( Their density is usually higher on rainy days when they gather in flocks and search for food in the middle of the bay, otherwise they can be seen flying quite high in the sky but then their number isn’t very high); BIG FISH ( We suppose that during the day they stay in the middle of the bay in deep water and in repaired places away from noise and predators; we noticed although that the herring near to the bay sometimes jump scared out of the water at night, we therefore think that this is because both seals and big fish come near to the surface and the skirt; BALD EAGLES ( These huge birds seem to be quite rare around the bay but during these weeks we saw two or three circling high in the sky.)
Waves: As we mentioned before we noticed that waves have a great influence on the animal behavior around the skirt, but we think that it also interacts with animals at a certain depth because the bigger the waves are and the more intense the current is the more food and material you get carried into the bay, therefore fish become more active. The opposite end of the issue is that any pollution or negative influences will also enter the system faster.
It is quite hard to quantify waves although we could measure the highest point reached by one of them on a stick attaching it to the docks and then the lowest one when the water settles down; we could then approximate the number of waves by counting the ones which pass through a certain spot in a certain lap of time and describe then their shape . This procedure could probably give as a quite clear idea of what the sea was like on a certain day.
==============================================
Sarah McEachern, Karine Gaulin, Marieve Therriault
The Astounding Ecological System of Pedder Bay
 It was the sixteenth day of September; a dark, rainy, dismal day when our brilliant Environmental Systems teacher got the ingenious idea of forcing us out into the elements. We plunged our hands into the ocean in search of life forms. We strained our eyes to catch sight of passing jelly fish and anchovies, we scraped our hands on barnacles and clams and we nearly fell into Pedder bay trying to count mussels.
================================================
Organisms of the Fouling System
by: Michal Mlcousek, Eva Mejnertz,
 t was a rainy morning when we went to Pedder Bay. We were supposed to survey many organisms, which we haven’t seen before in our countries. It was a very nice introduction to a new subject – Environmental systems, which aim is an attempt to understand and realize everything as a system, depending on many factors.
Purpose of the field lab : To gain a better understanding of the structure and function of the eco system, through a practical exercise.
Procedure: We lifted the rubber skirt protecting the docks, to observe the many organisms that were part of the system, depending on each other.
Structure biotic species list:
-
-
mussel
-
-
algae
-

-
limpets
-
-
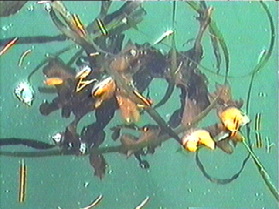
drift Fucus
-
-
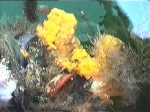
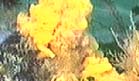
Halichondria,, yellow sponge
By Michal Mlcousek,and Eva Mejnertz
================================================
By: Merideth Shaw, Kuba Fast, Rocio Martinez, Monica Segura
Introduction
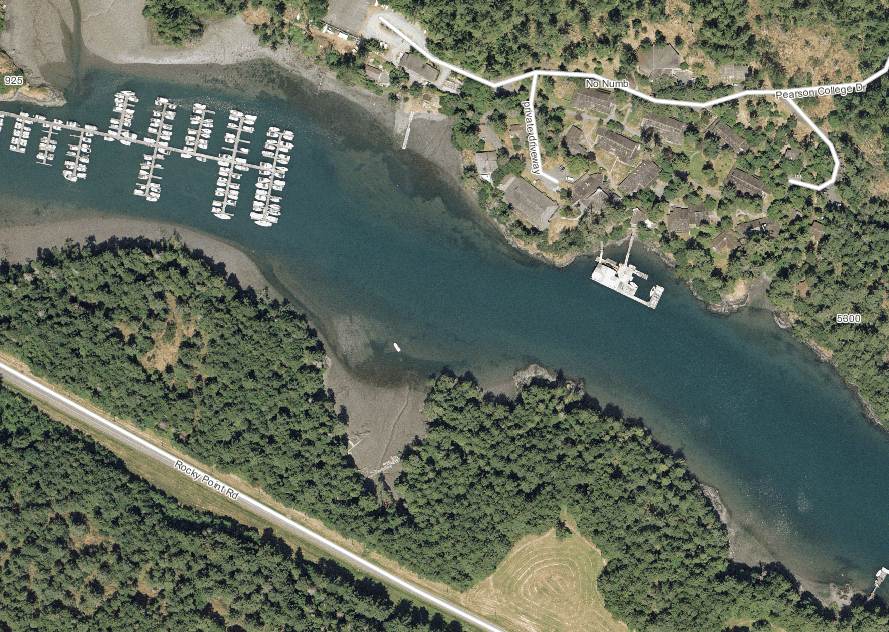
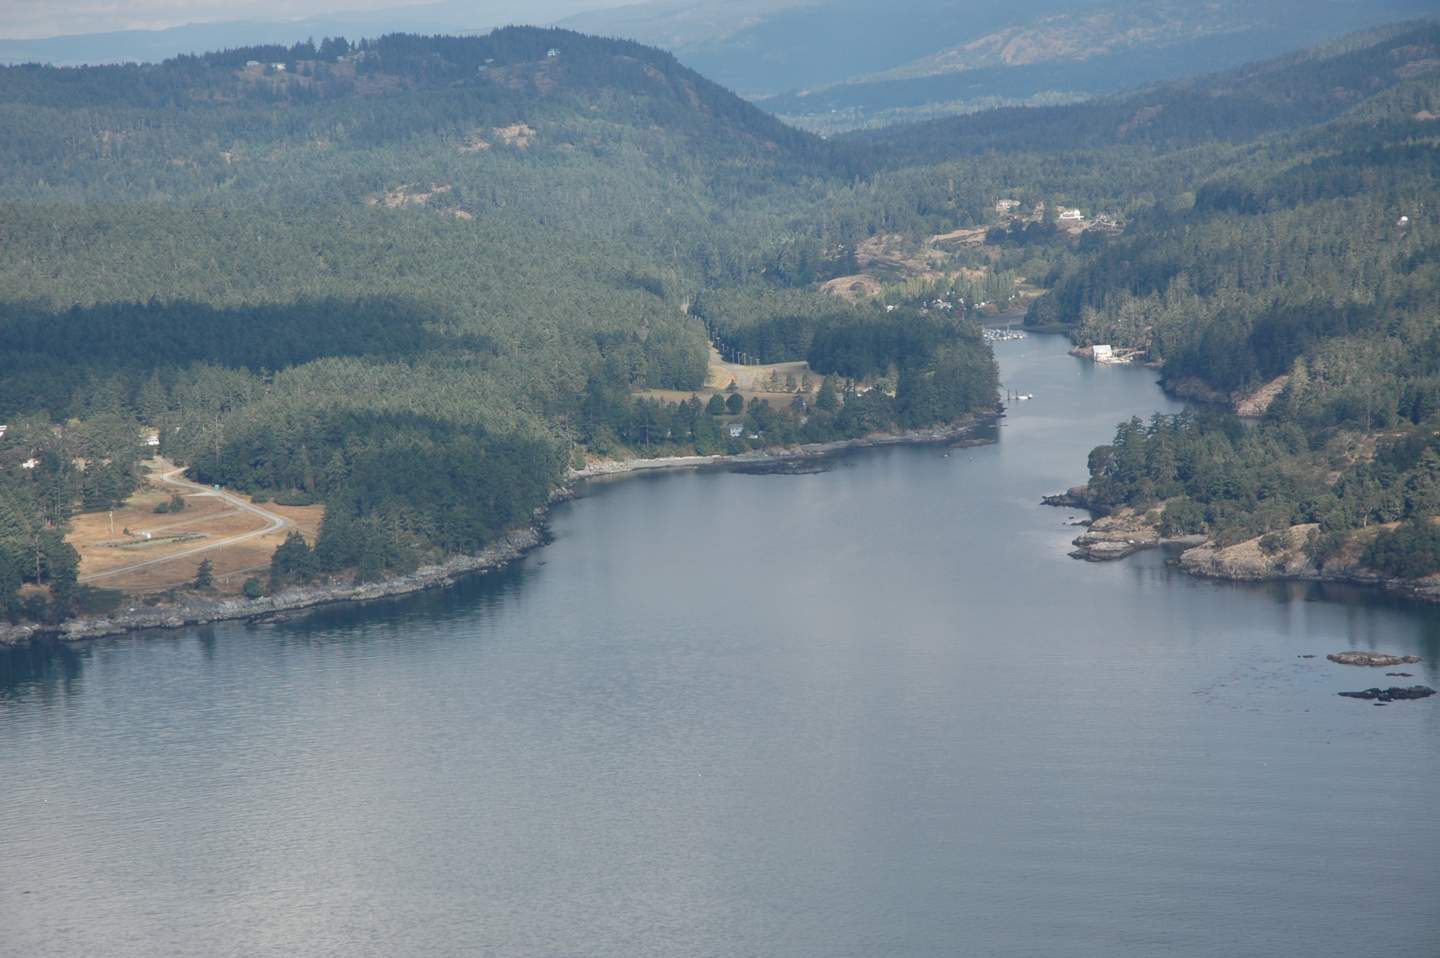
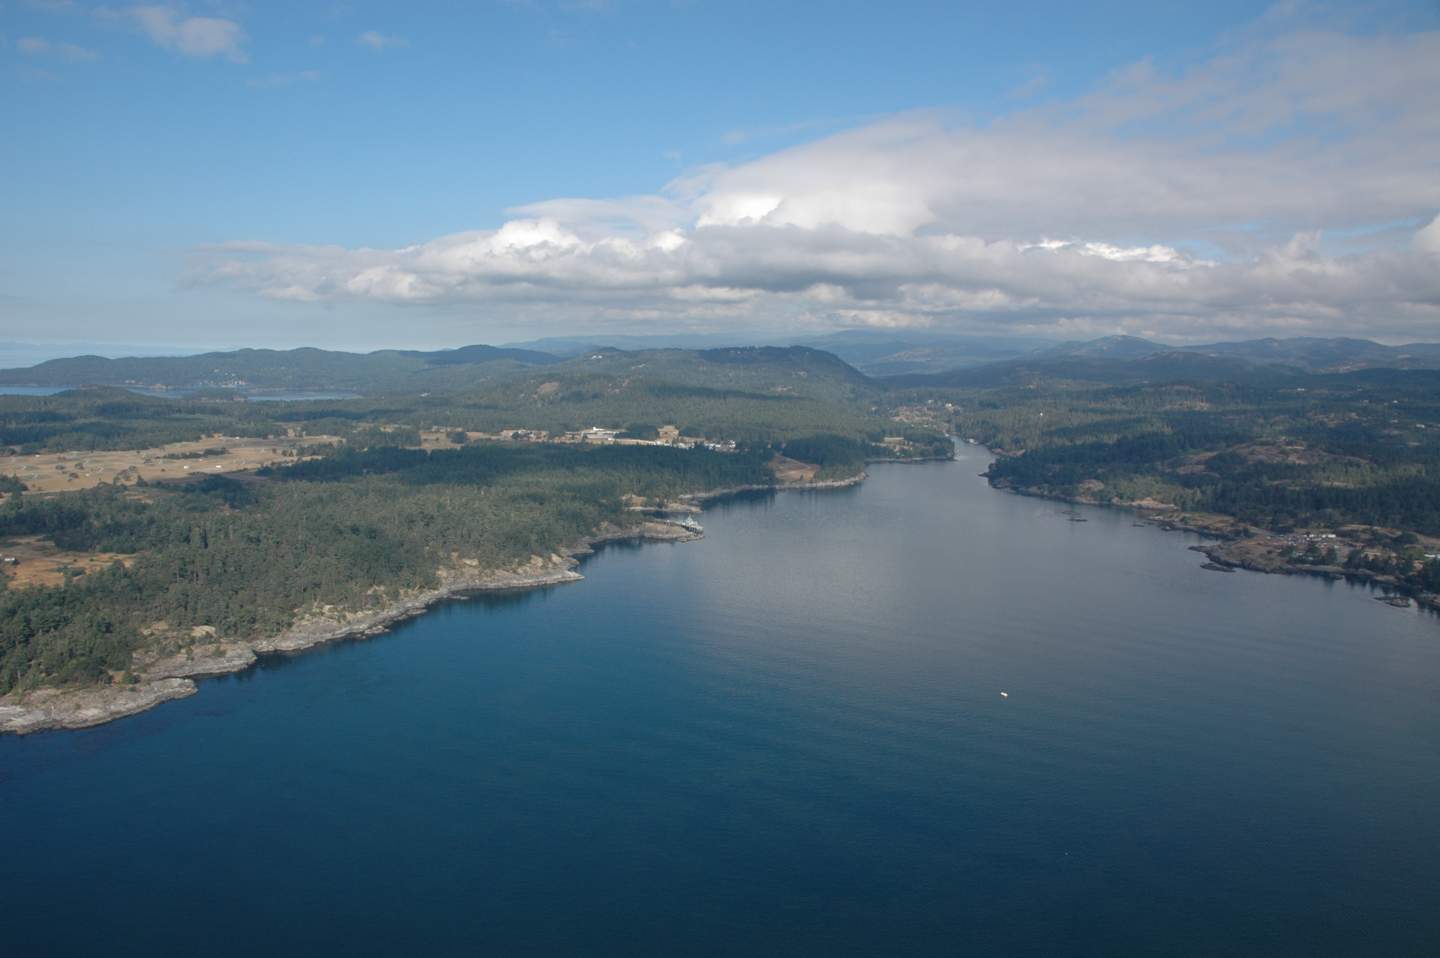
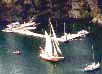
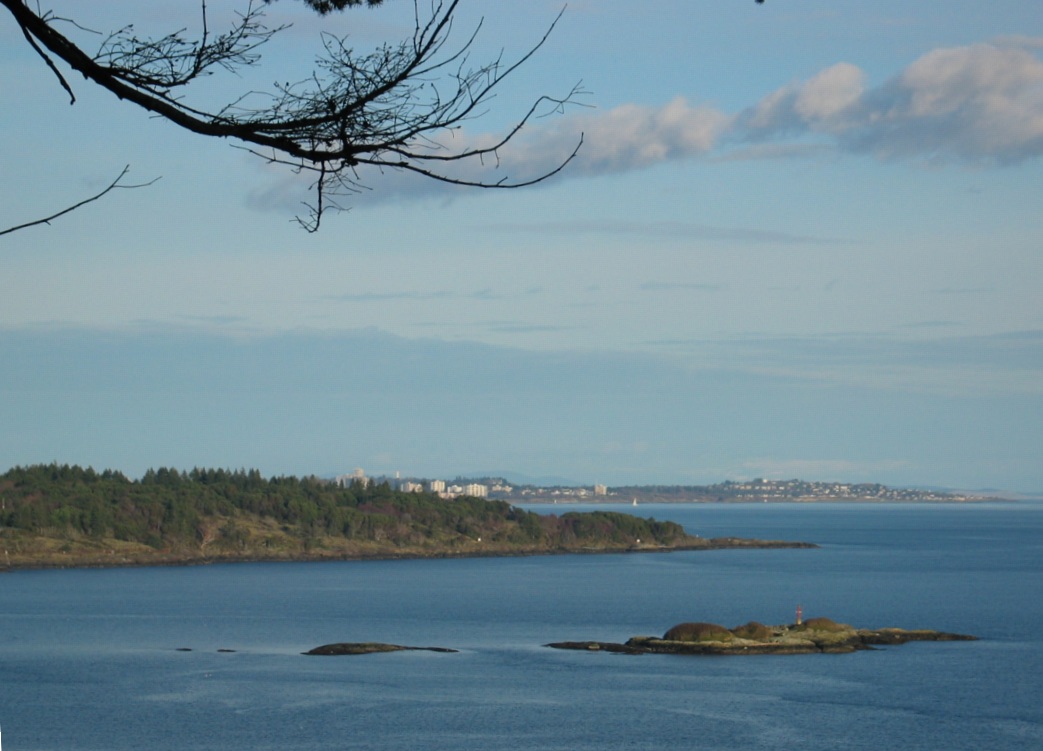
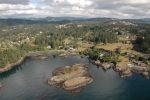
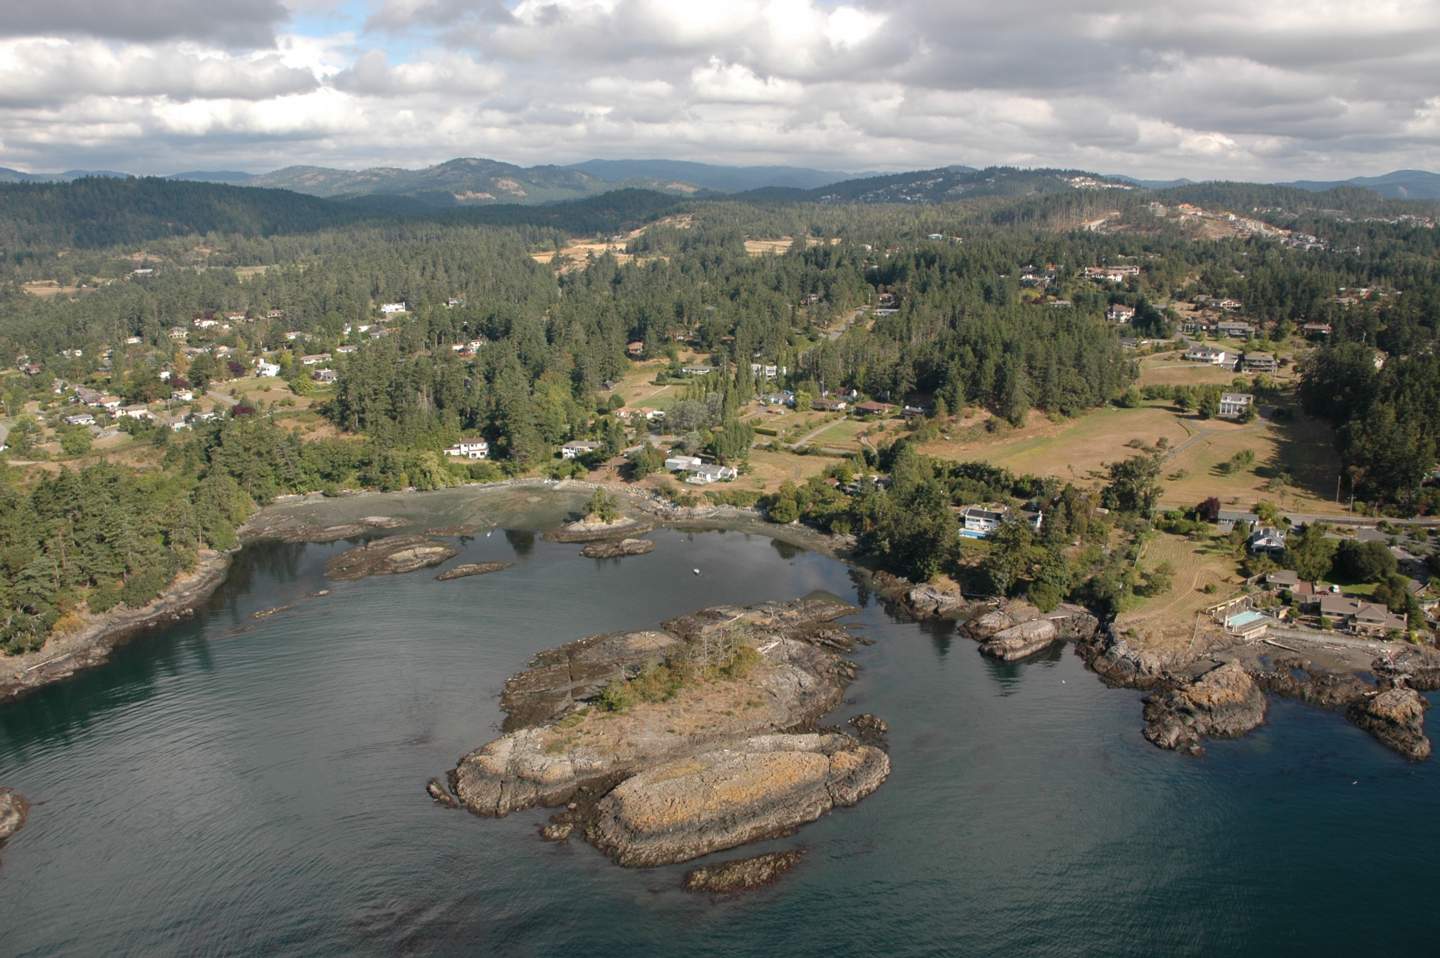
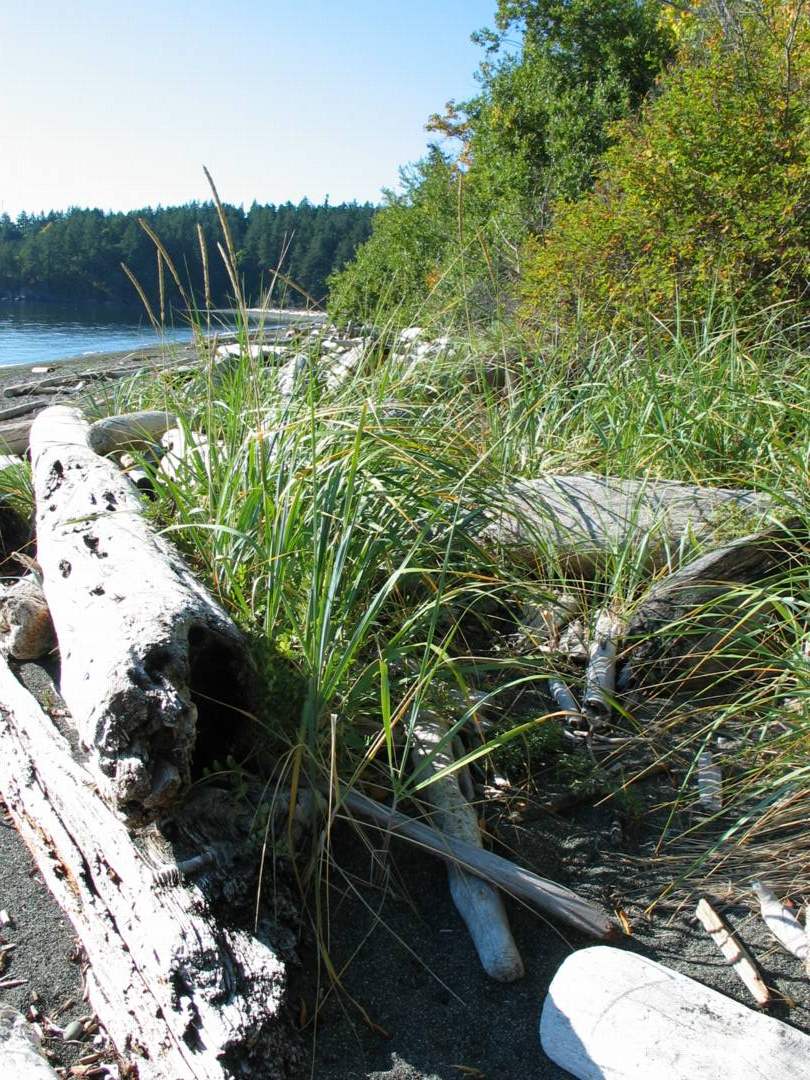
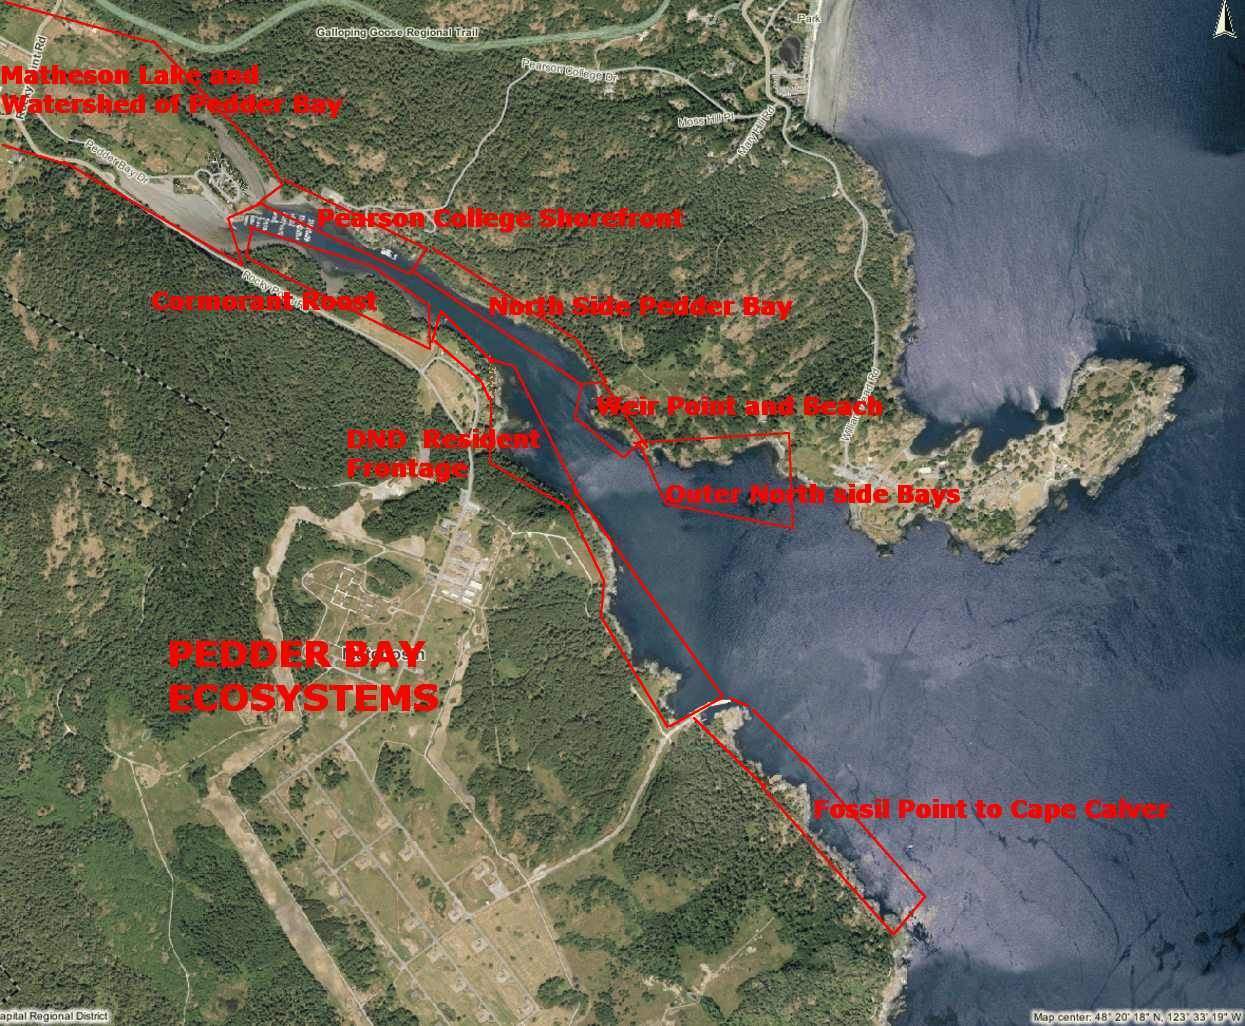
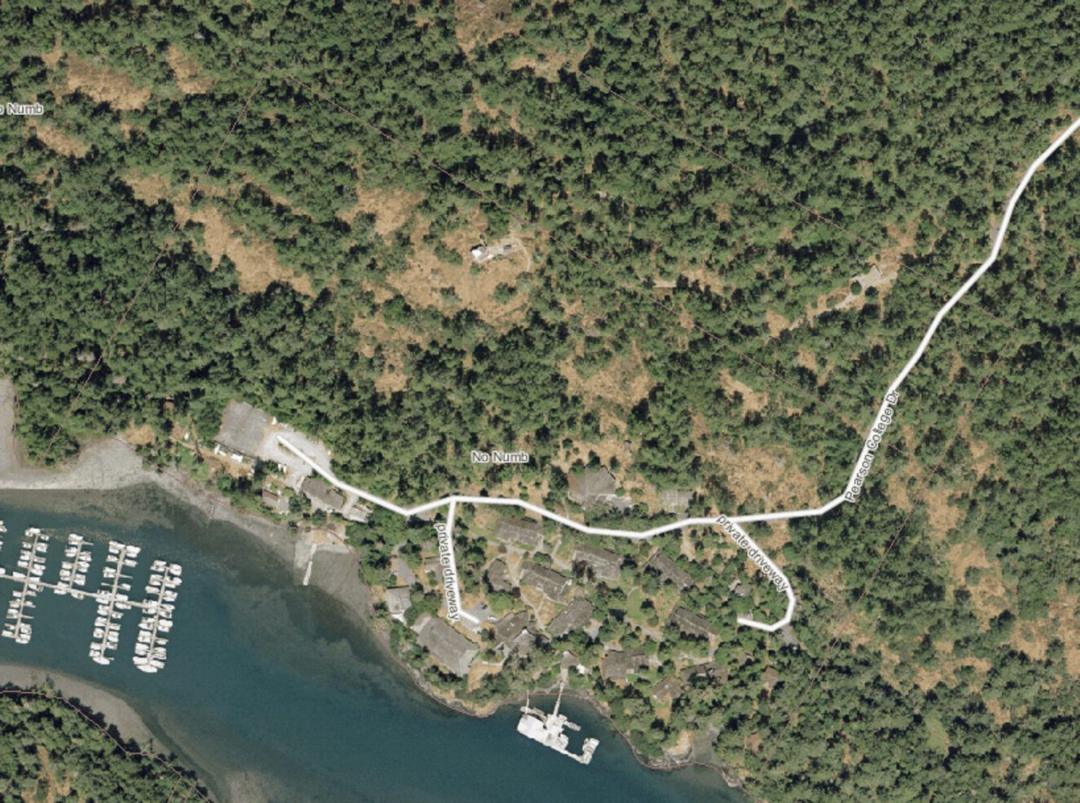
 In our first environmental systems lab we went down to the college docks to examine the ecosystem of its protective rubber skirt. Pearson College is located on the northern shore of Pedder Bay, at the southern end of Vancouver Island. The bay is open to the southeast to Juan de Fuca Strait. It has a rock shoreline and is about 10 meters deep. It has tides of up to 3.3 metres, with the waves of up to 2.5 metres in extreme. The weather conditions around Pedder Bay are not at all severe – with usually wet and mild winters and cold and dry summers, with very low annual temperature amplitudes. Due to their southern exposure, the docks receive a fair amount of direct sunlight.
Purpose of this lab
The purpose of this lab is to model the structure and function of the Pearson College docks’ fouling system
Biotic structure
(i) Species list
-
-
mussles (about 20-30 encountered)
-
-
Obelia , barnacles(80-90)
-

-
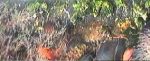
pine needles, – leaves
-
-
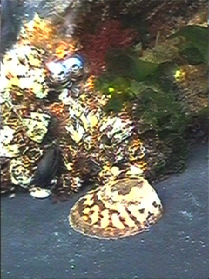
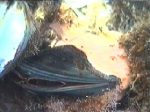
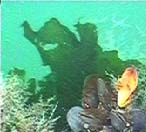
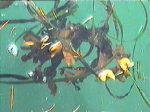
The strata of organisms on the dock
-
-
haliclona & halochondria
-

-
limpets 1.
also : – isopods,– small fish.
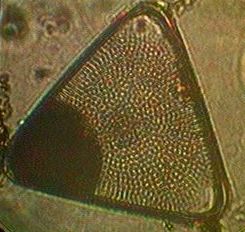
plantae:– ulva,– filamentous diatom.
By: Merideth Shaw, Kuba Fast, Rocio Martinez, Monica Segura
===============================================
By: Nick Lanham , Alex Gesheva, Andreina Torres Angarita
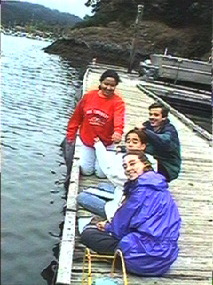
-
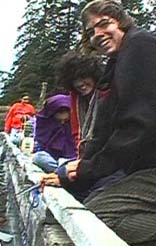
-
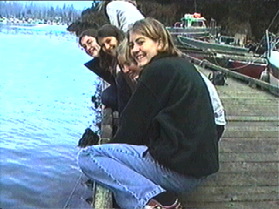
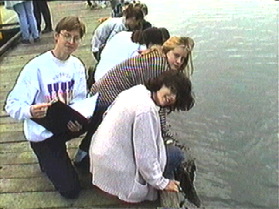
Us at the dock
-
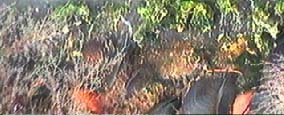
-
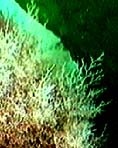
The strata of organisms on the dock
Purpose
 To model the structure and function of the ecosystem of the life growing on the rubber skirt using a functional diagram with Odum symbols.
Biotic Structure
Species List:
| Mussels |
Limpets |
| Isopods |
Barnacles |
| Algae( Ulva) |
Algae (Diatom) |
Horizontal Distribution:
The organisms in our system were, for the most part, evenly distributed horizontally along our system. The exceptions were mussels, which were clumped in some areas, and very sparse in others, and the limpets, which were randomly scattered throughout.
Vertical Distribution:
There was a clearly defined vertical distribution in our system. The young Ulva algae grew near the top, as it needs more light and heat and as we moved deeper the mussels and older algae began to show up.
Abiotic Factors
We took 2 separate measurments of the temperature of the air and of the water in our system. The average air temp was 16.5. The water avarage was 10.5.
System Boundary:
By: Nick L. , Alexandra G., Andreina T.
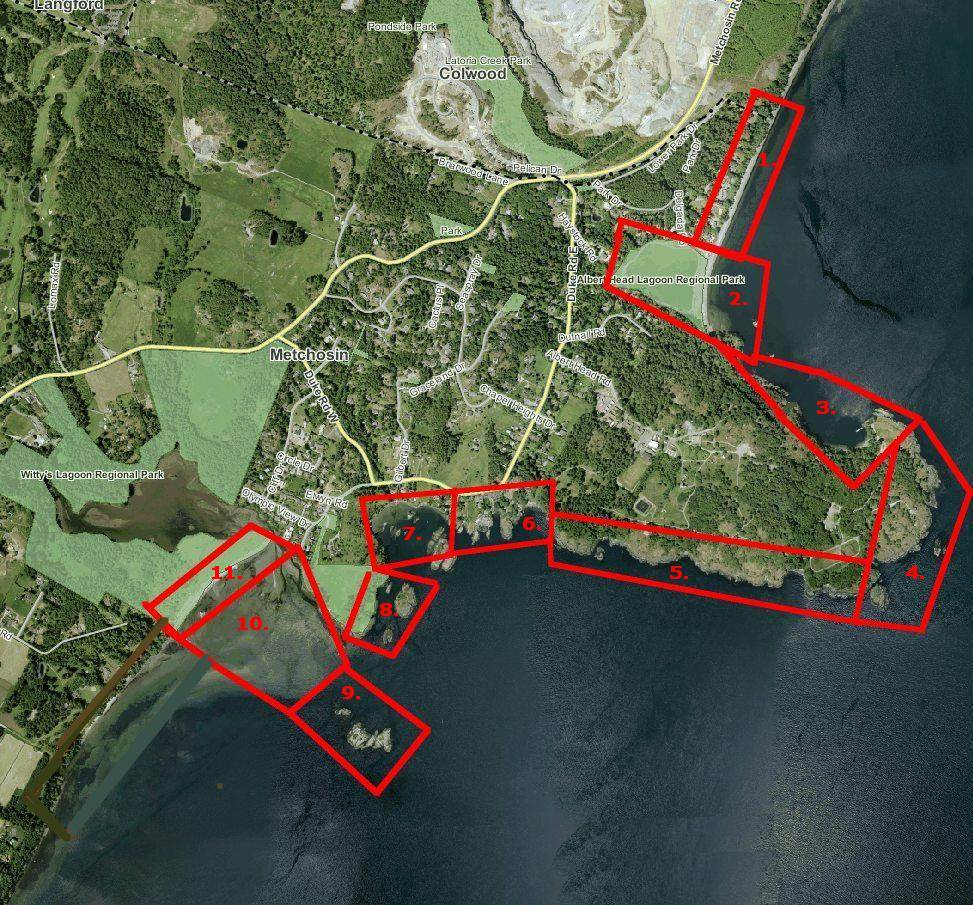
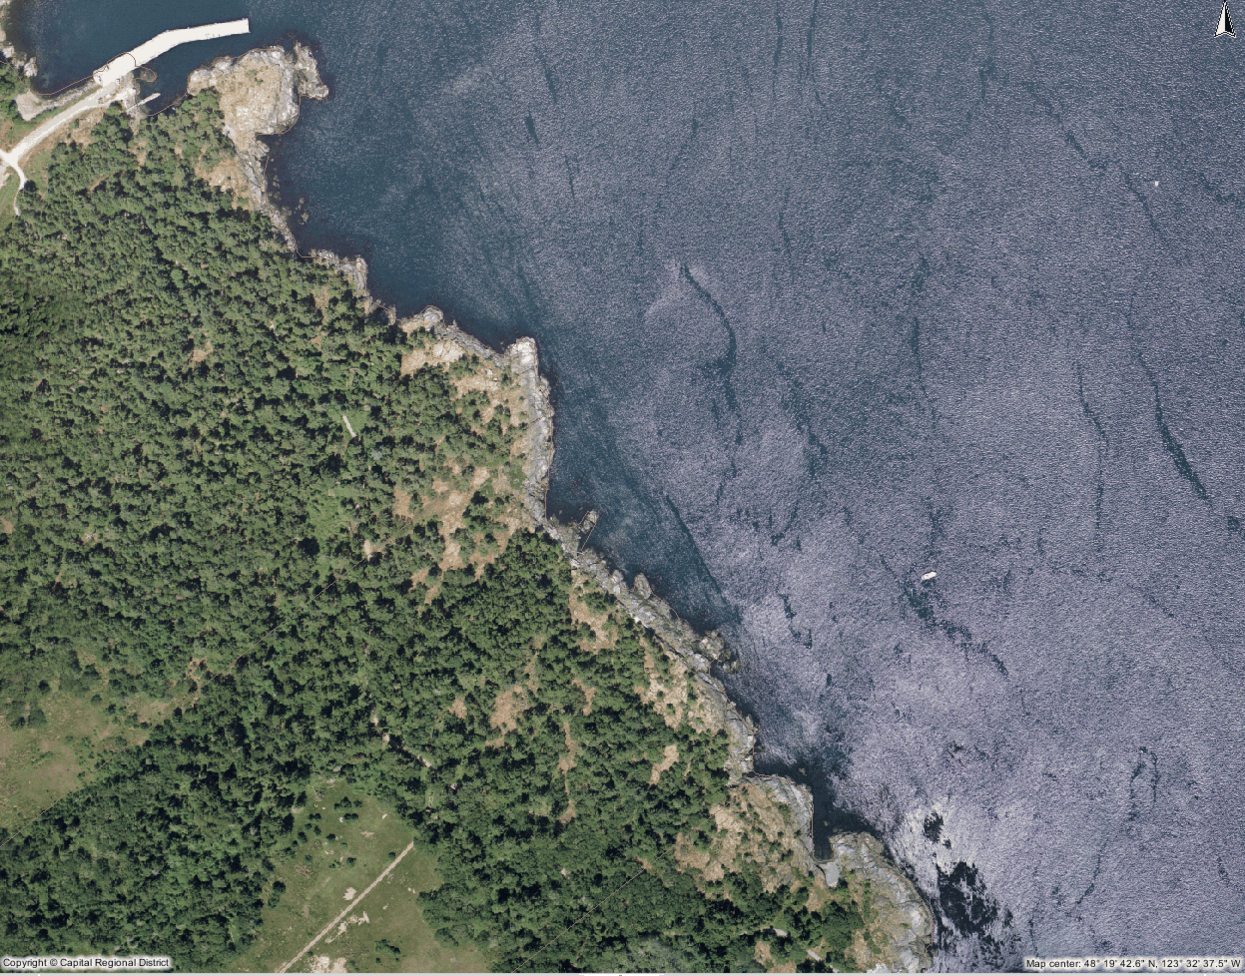
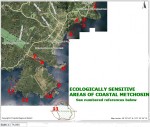
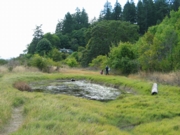
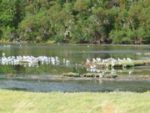
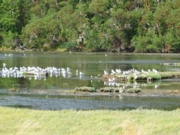
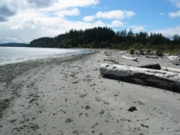
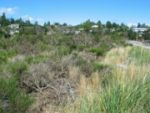
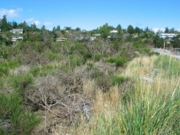
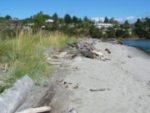
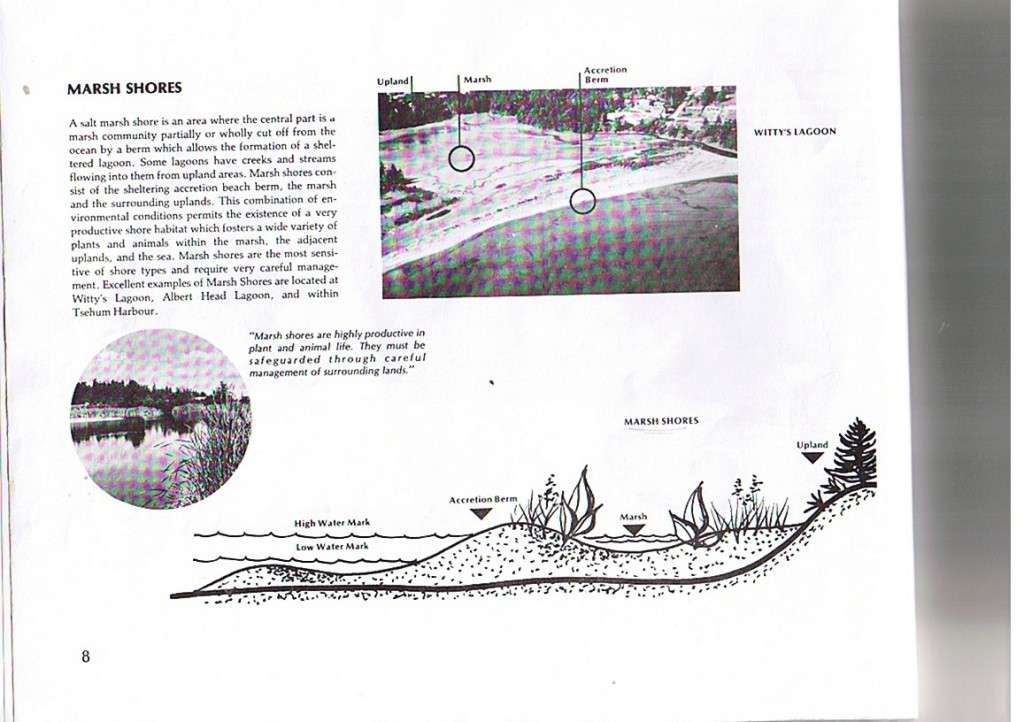
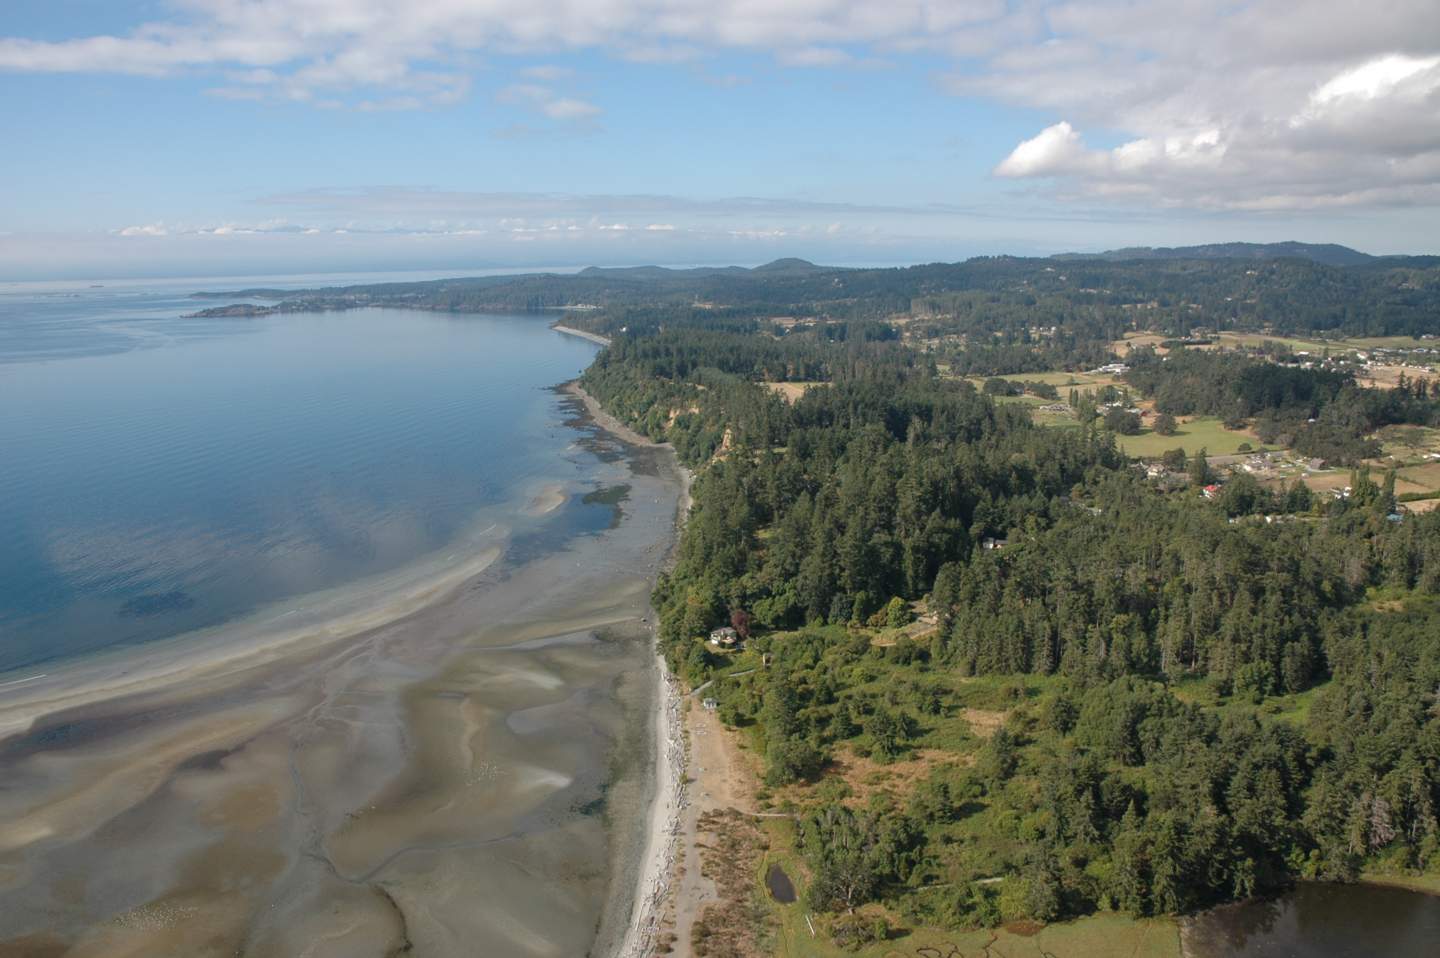
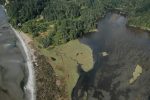
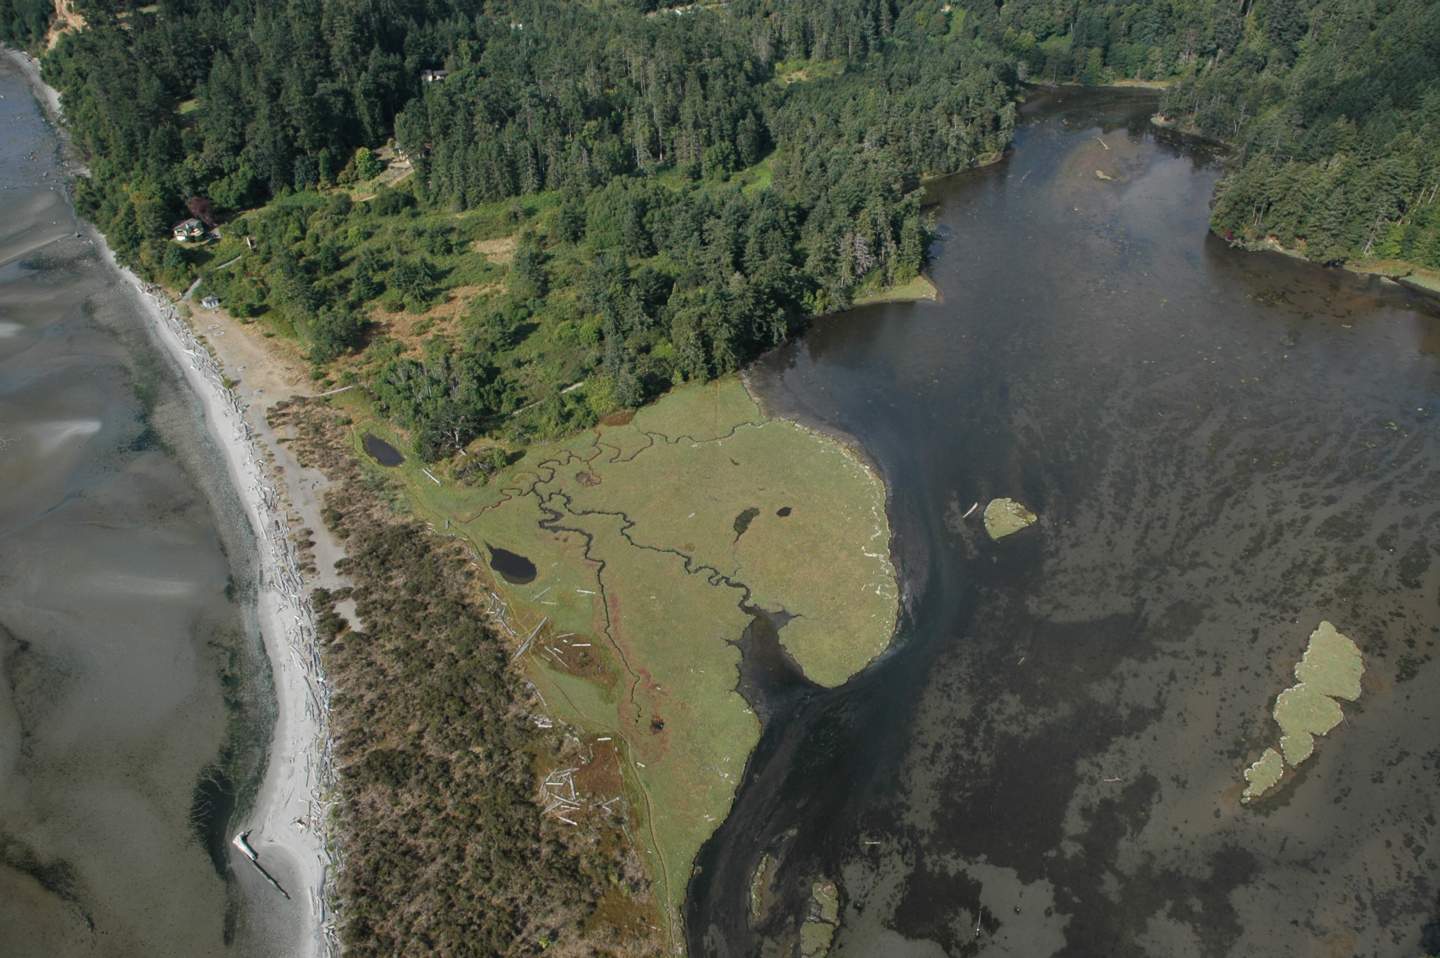
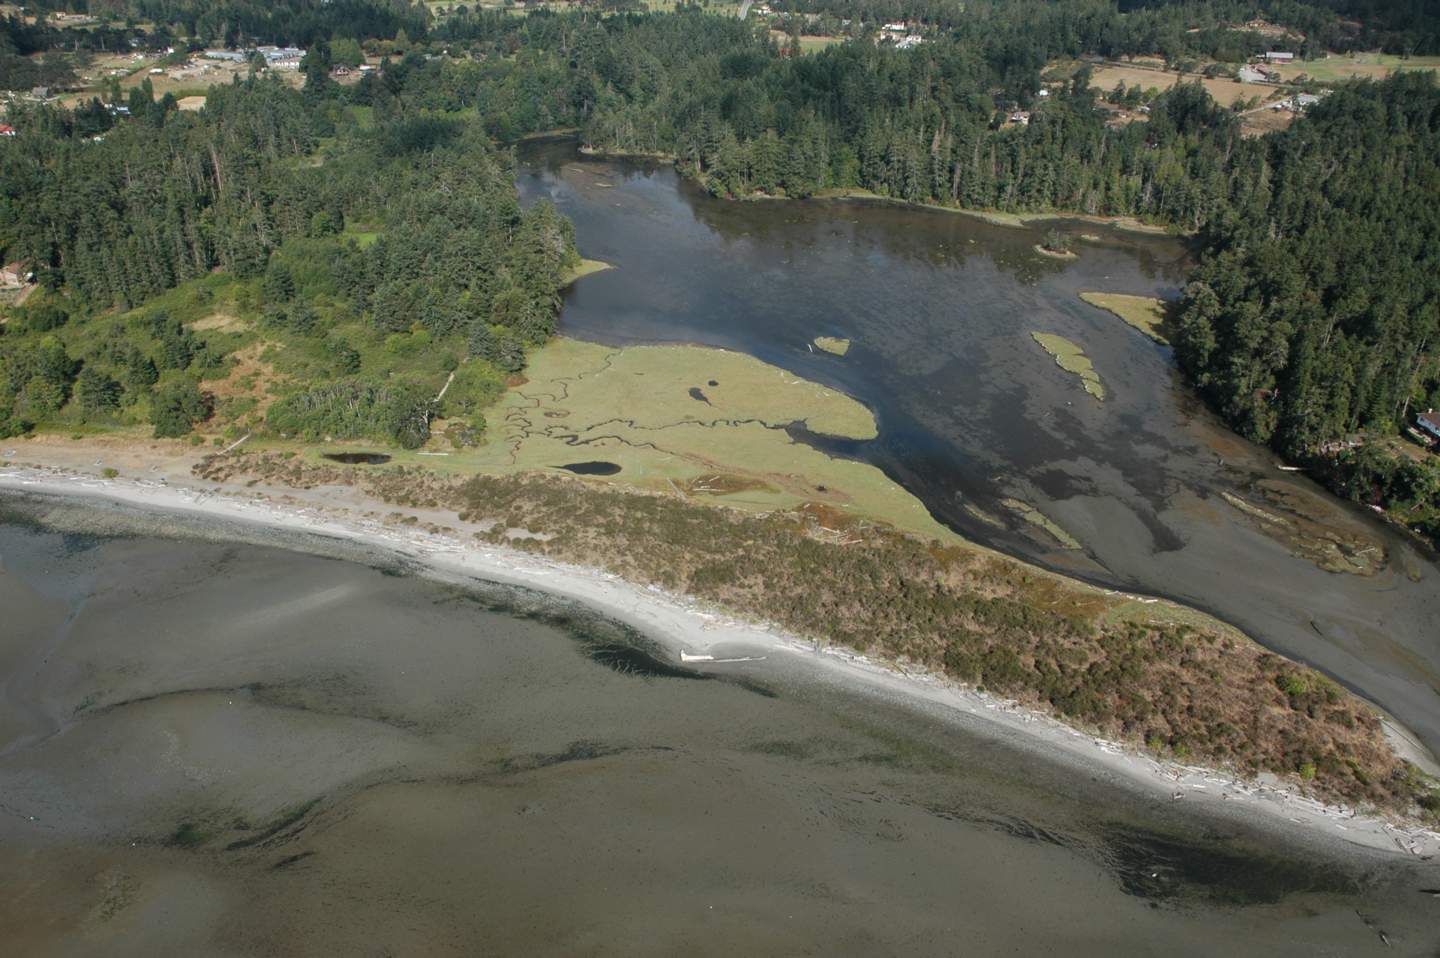
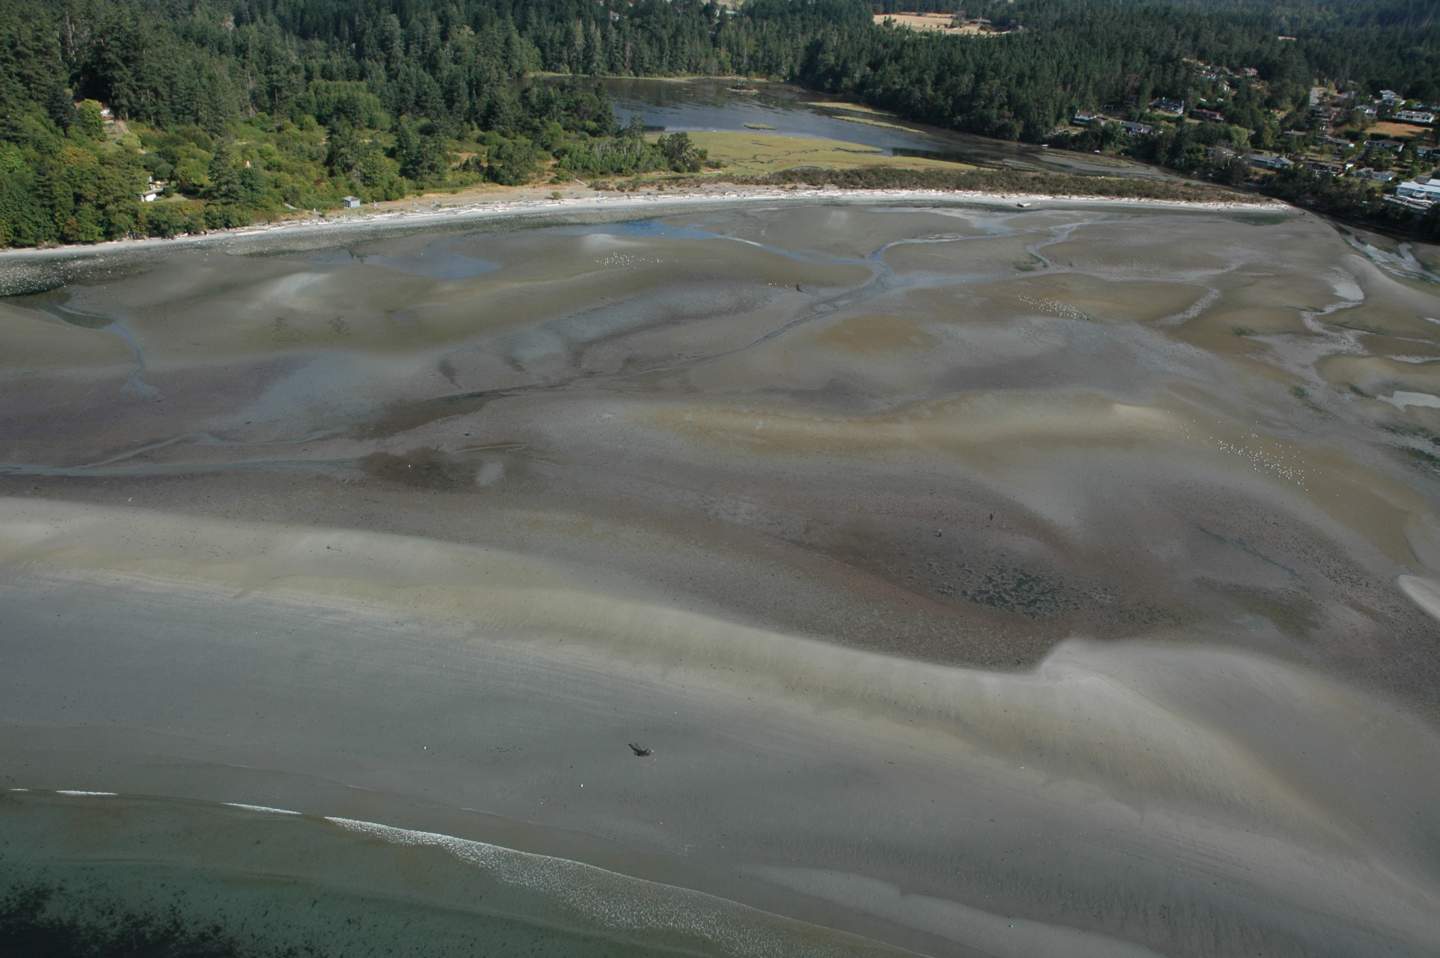
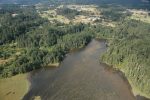
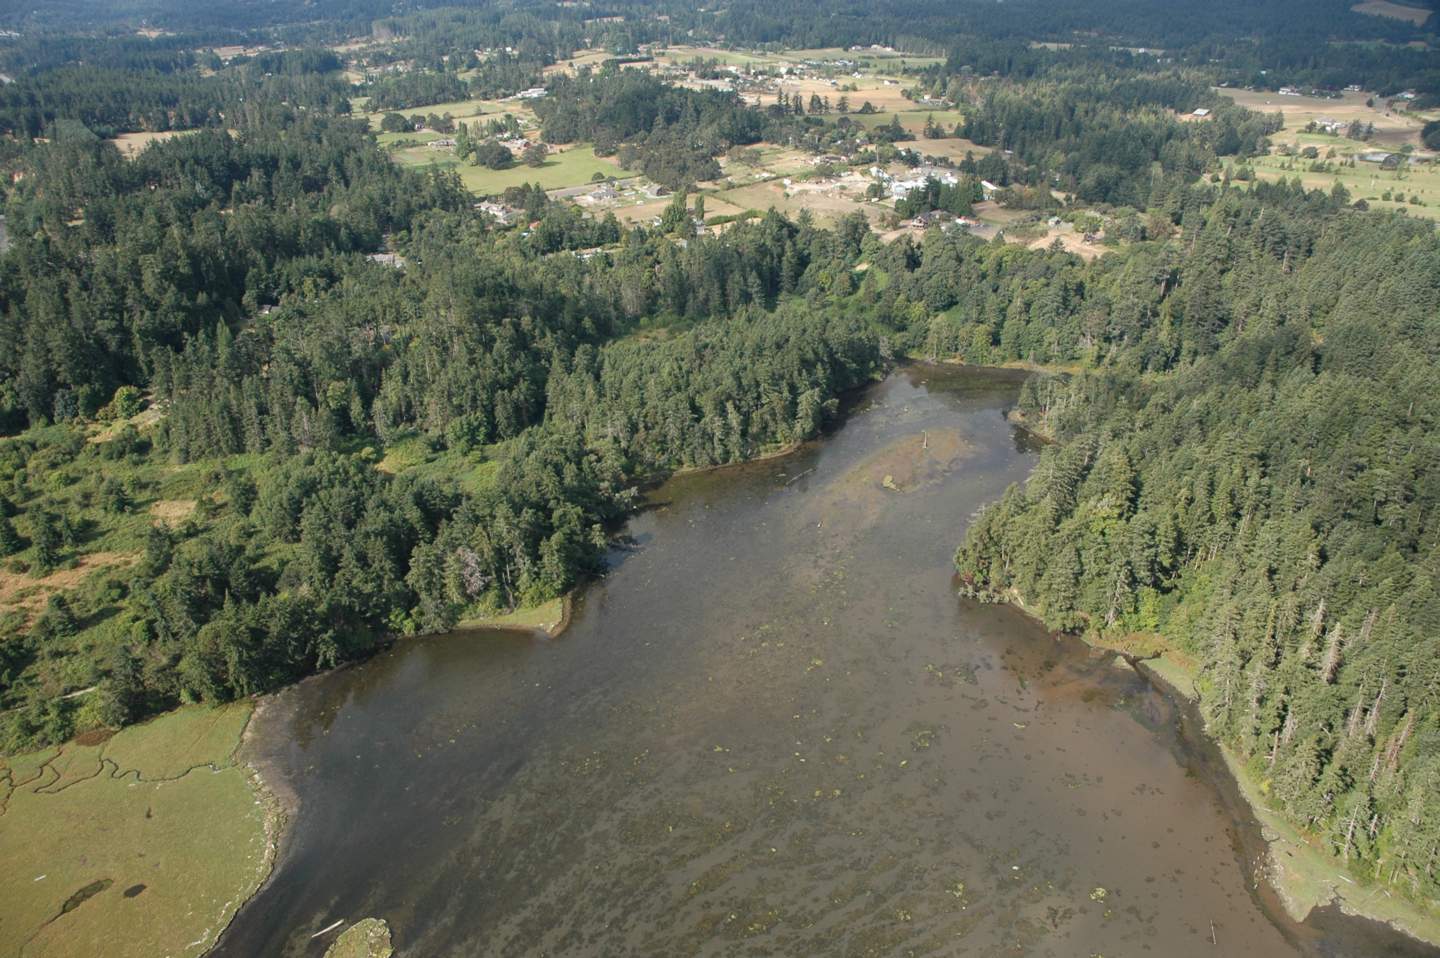
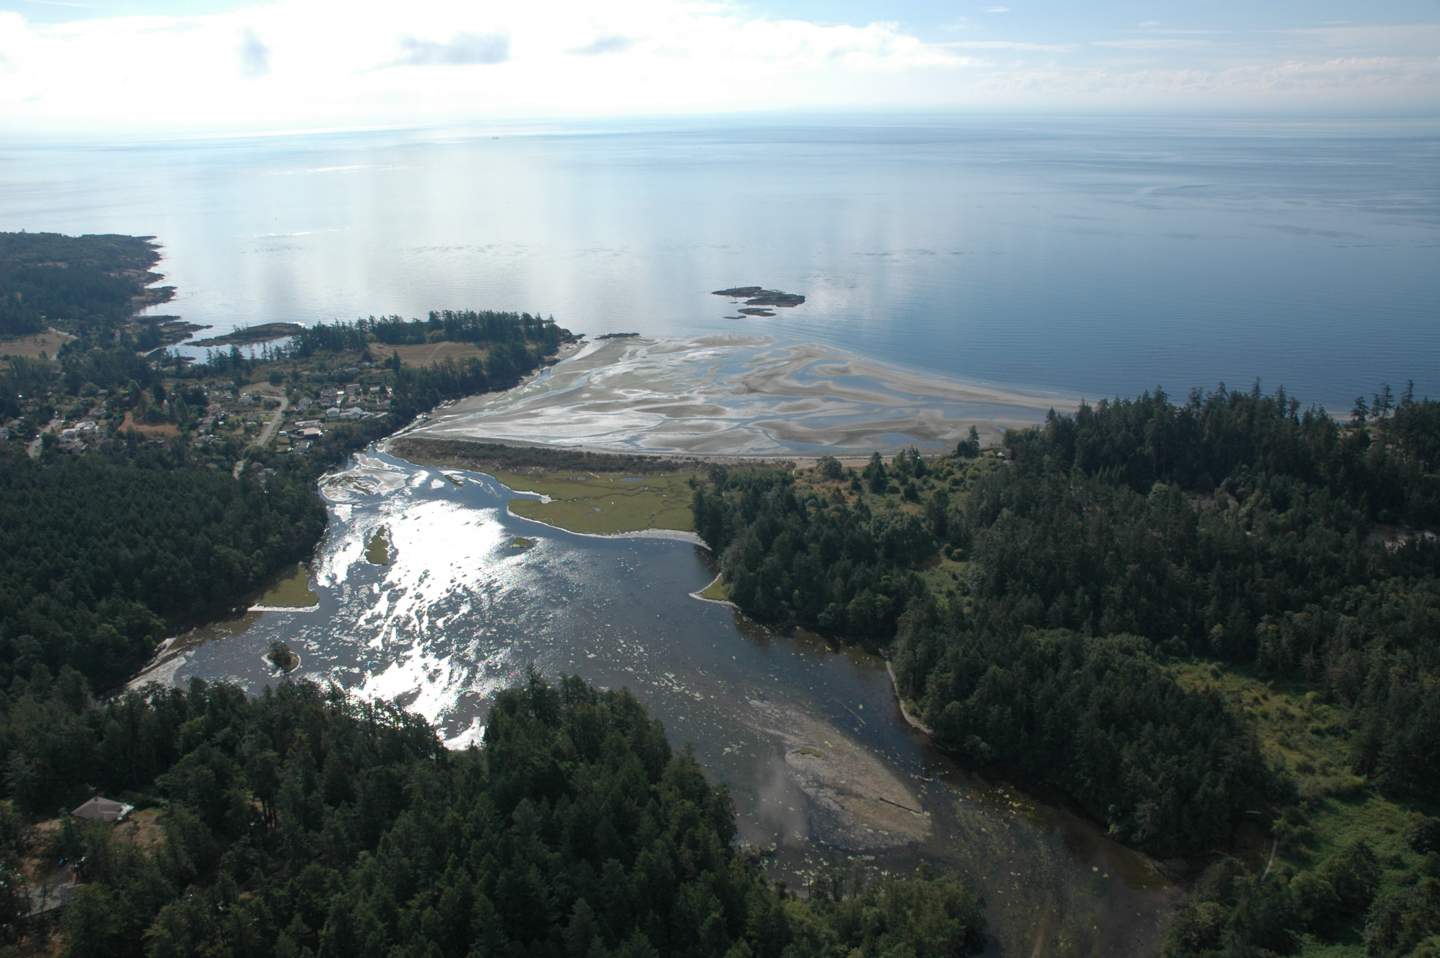
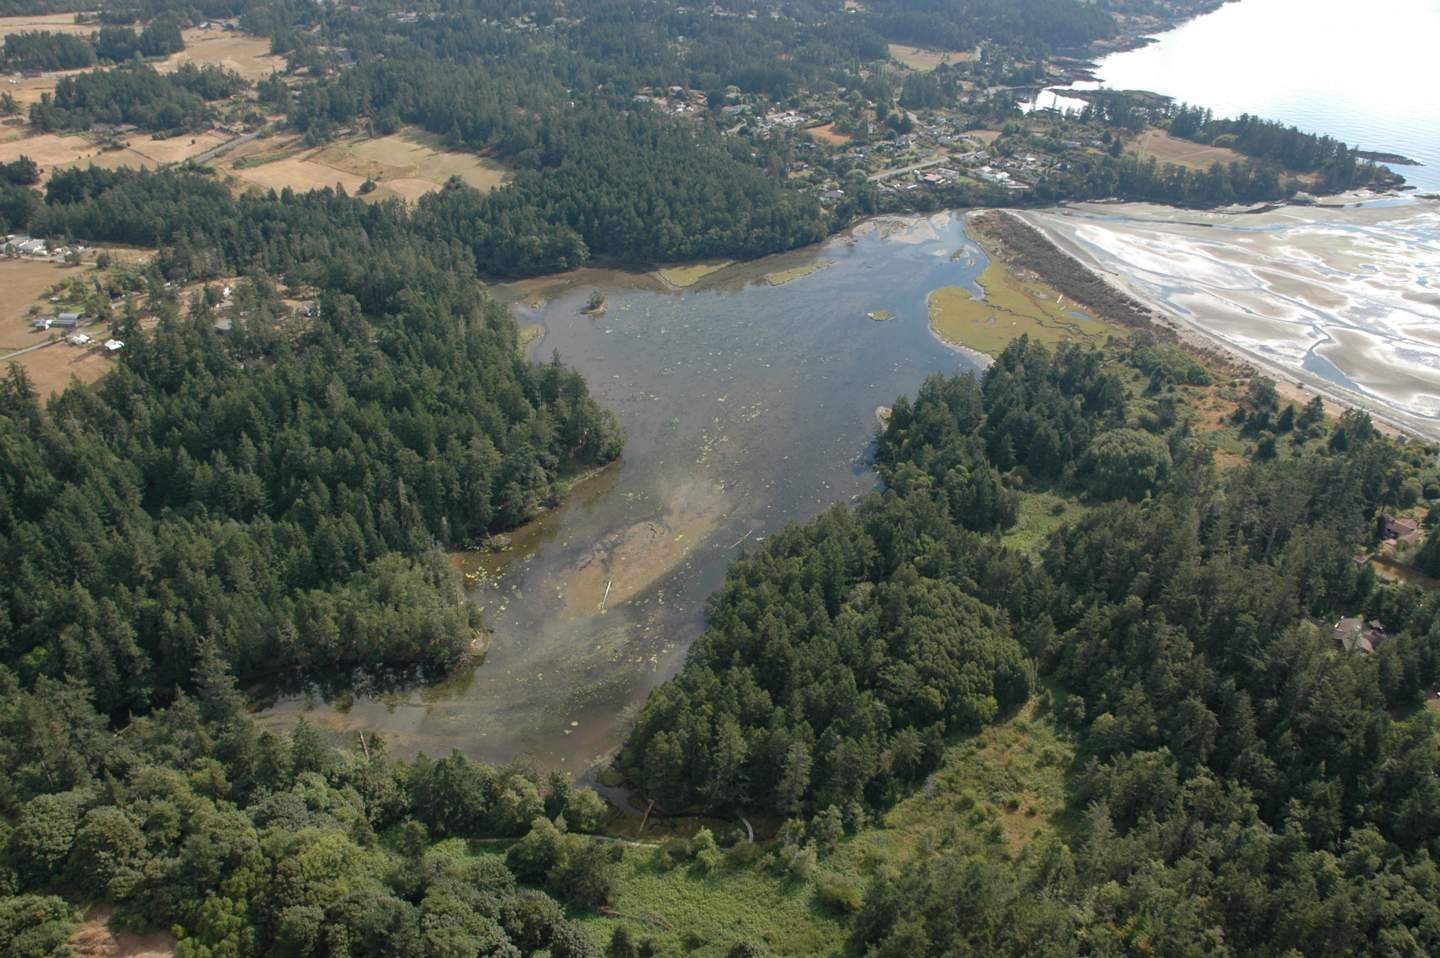
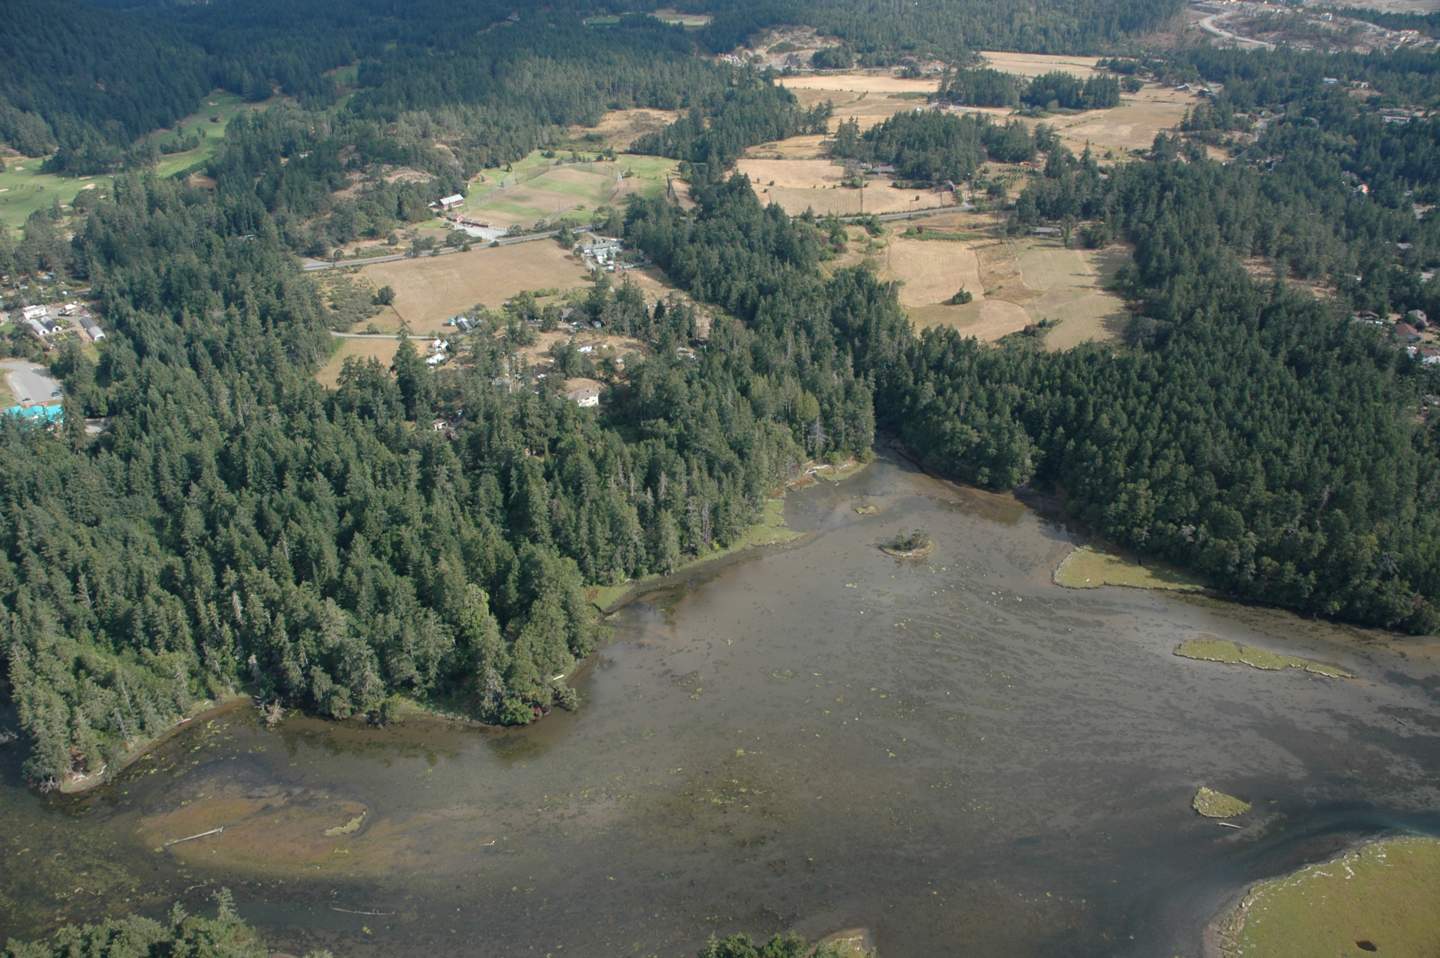
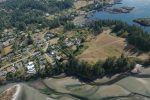
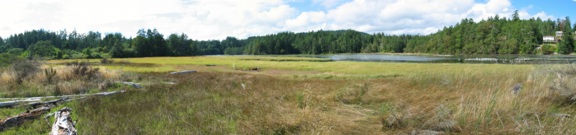
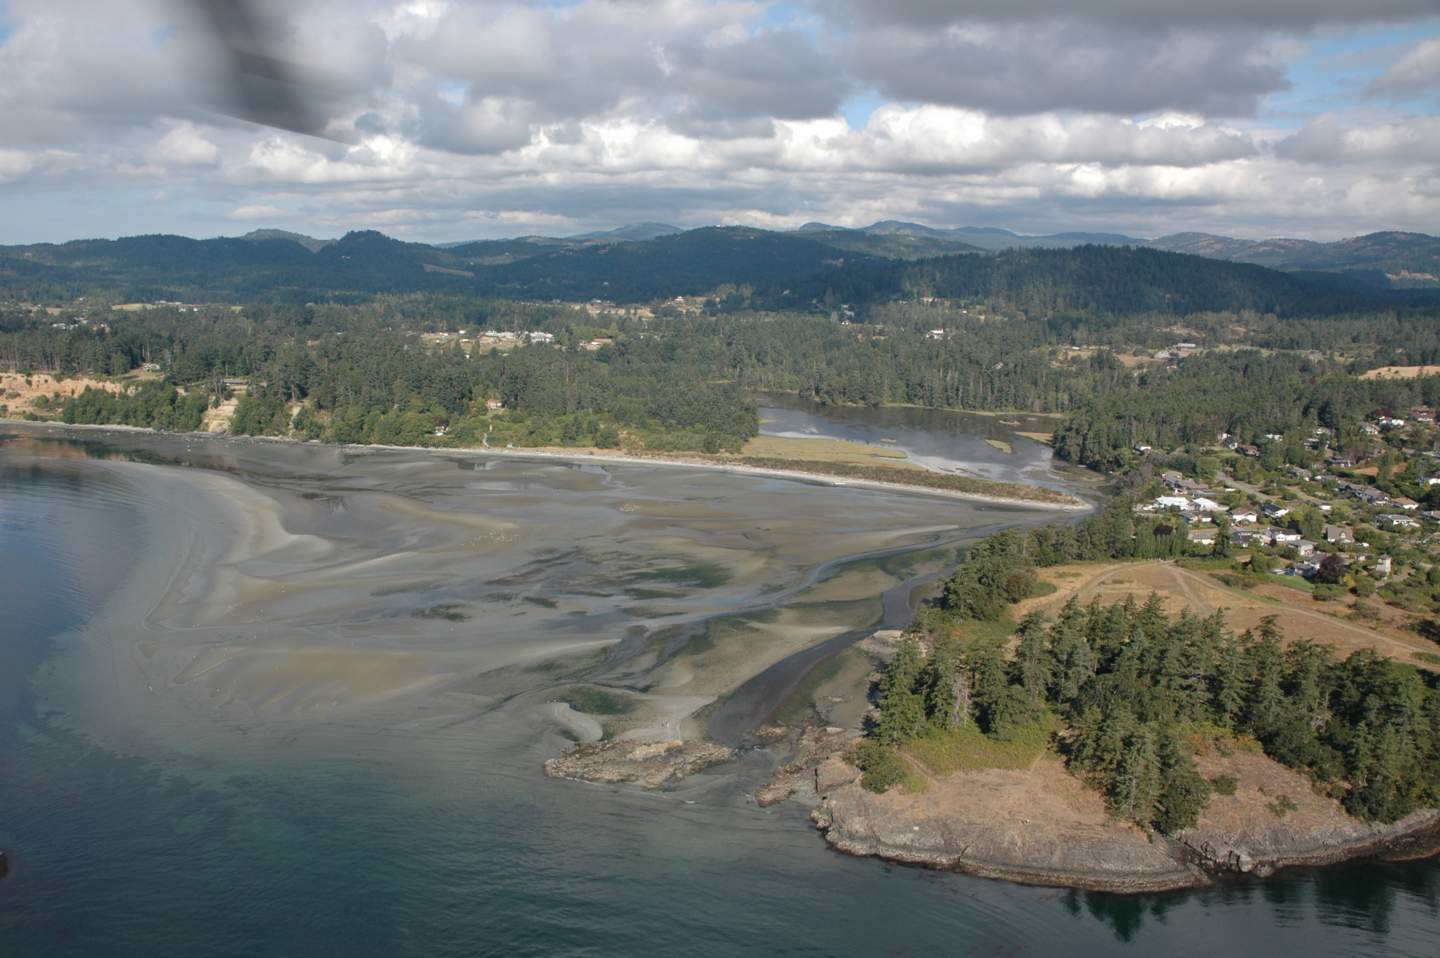
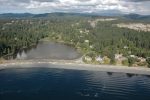
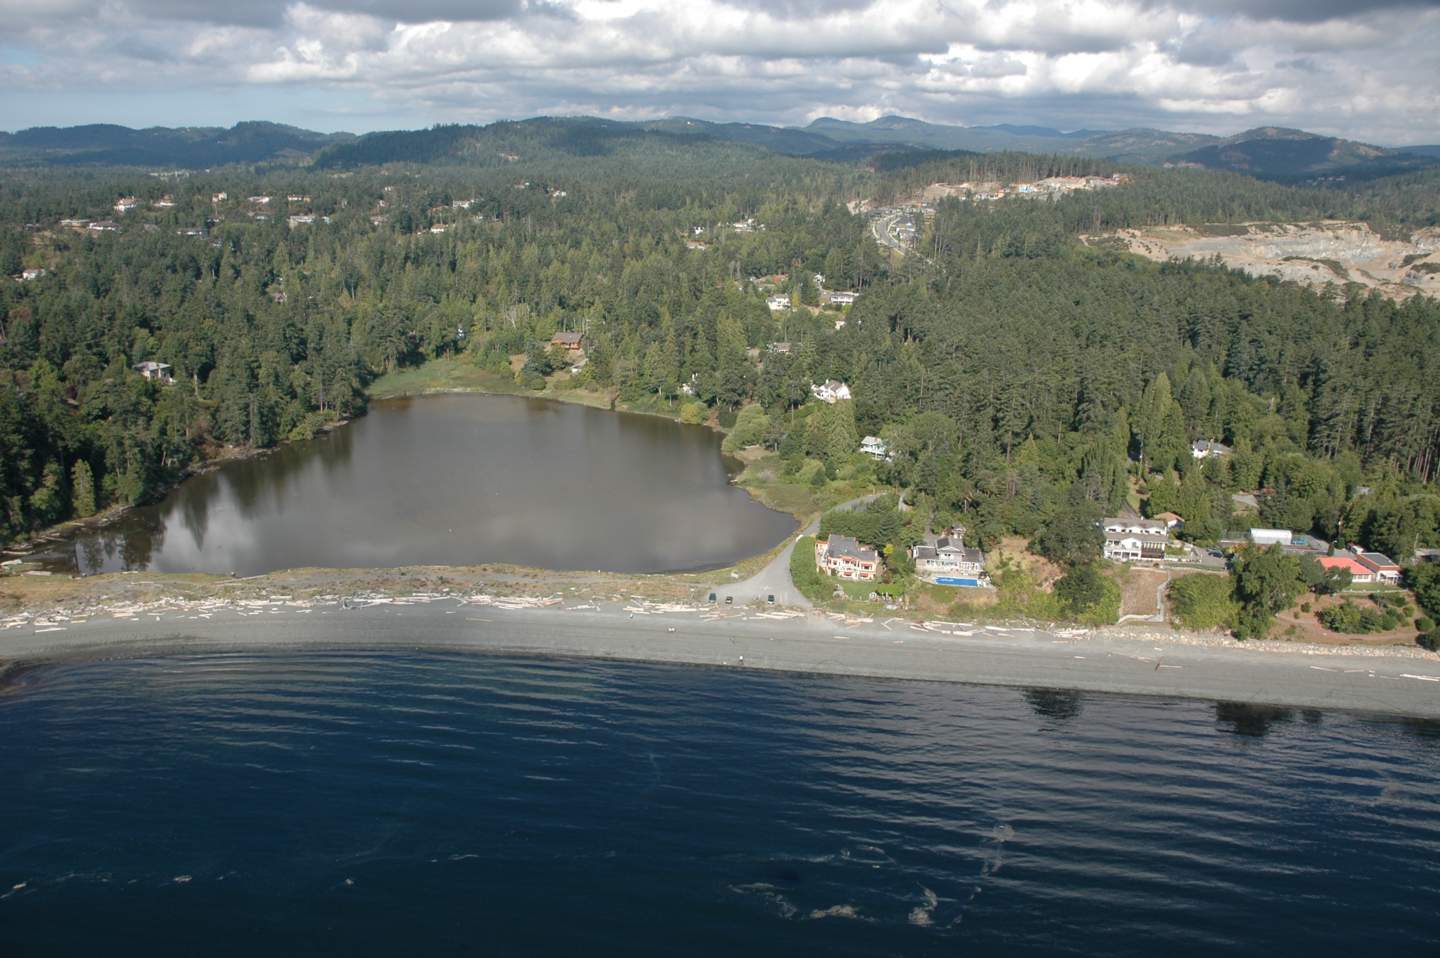
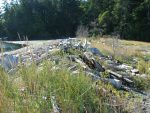
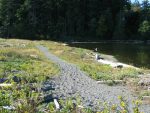
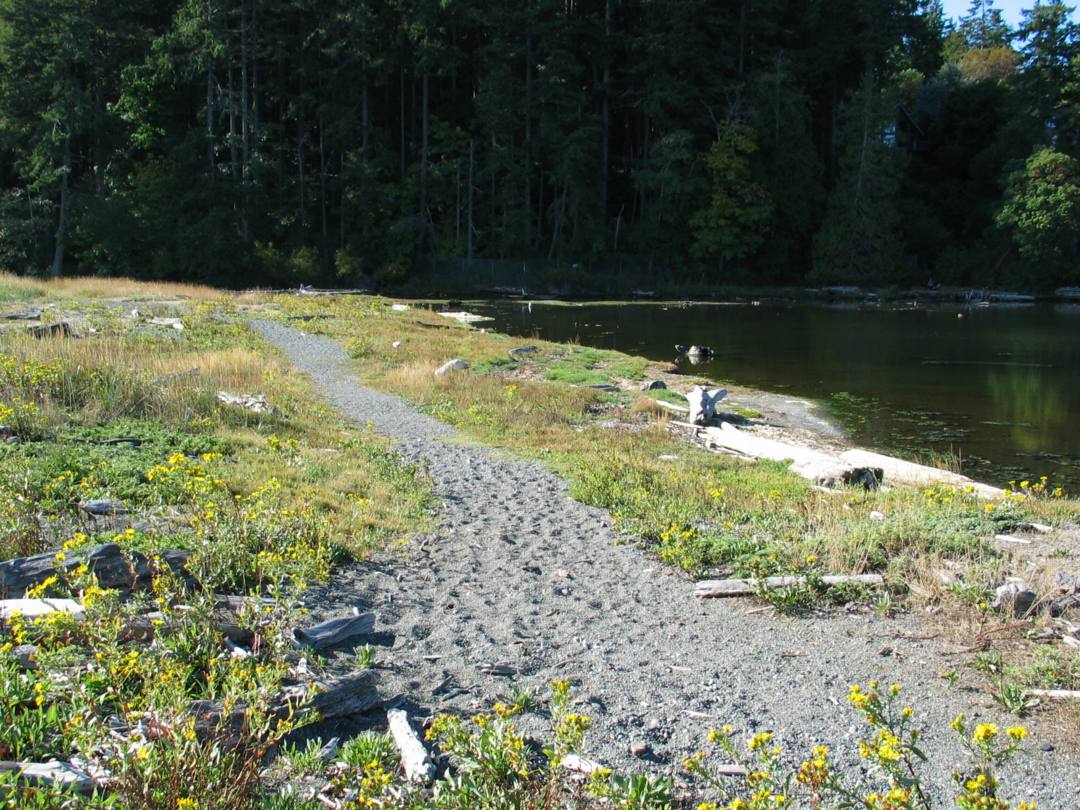
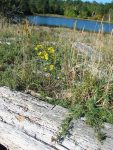
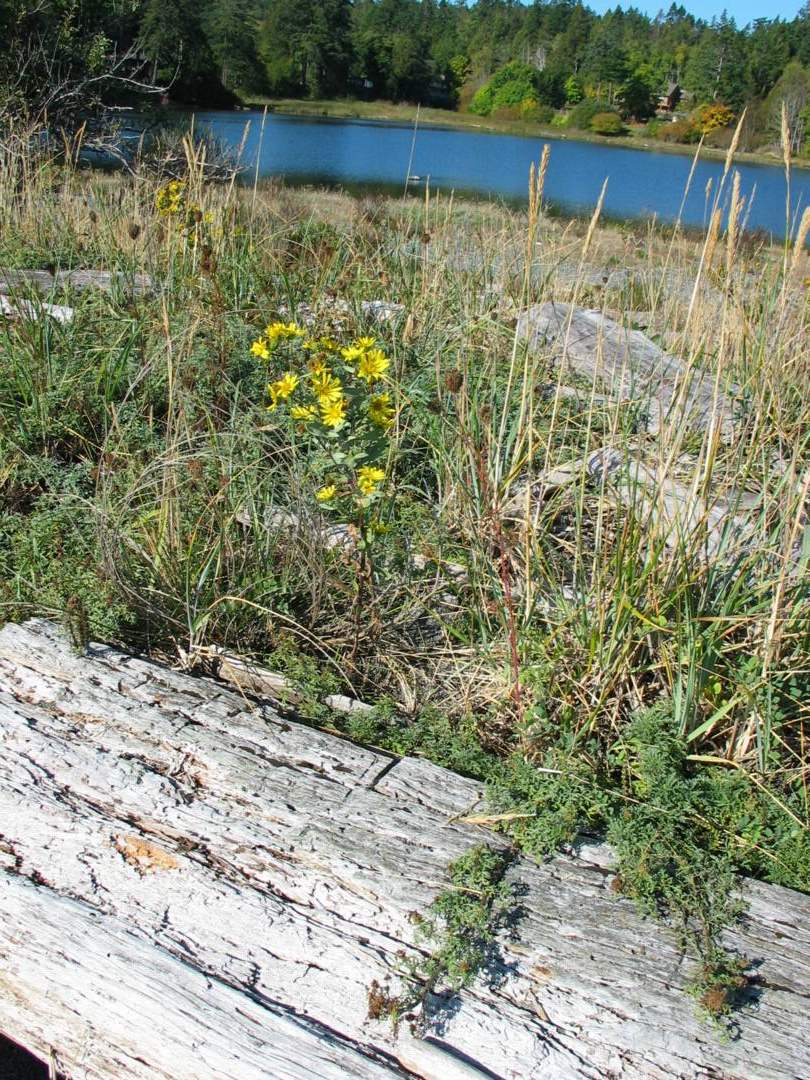
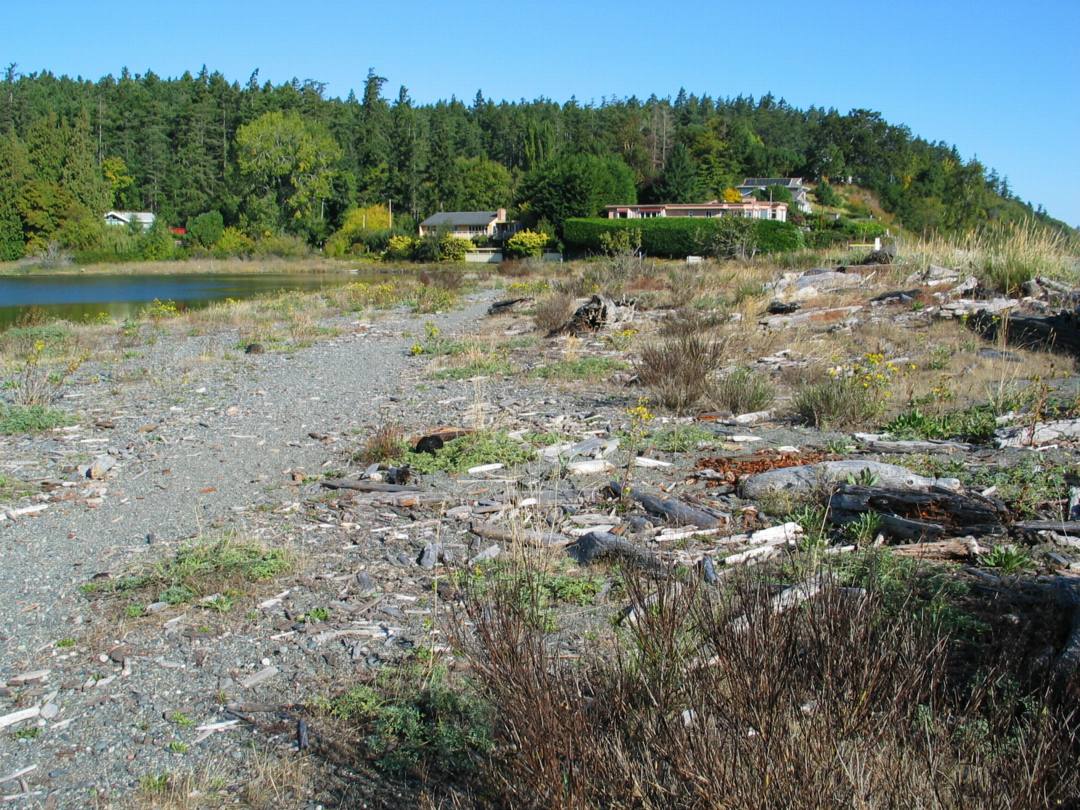
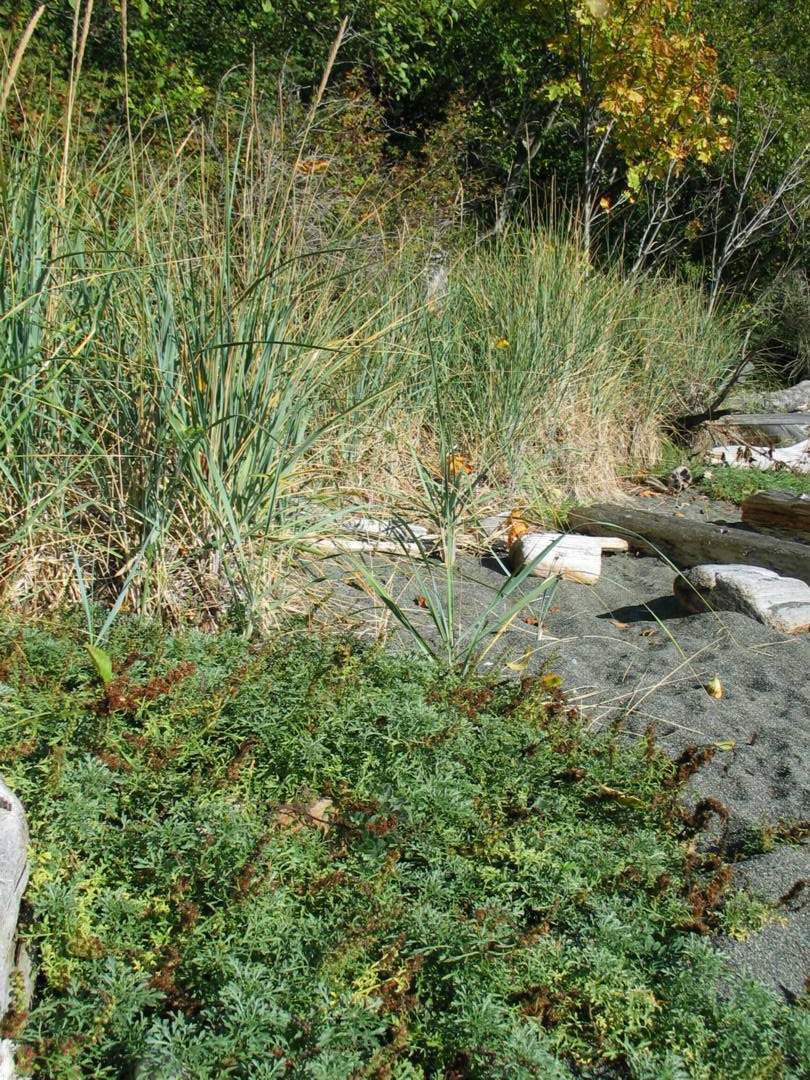
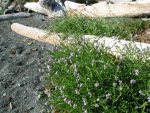
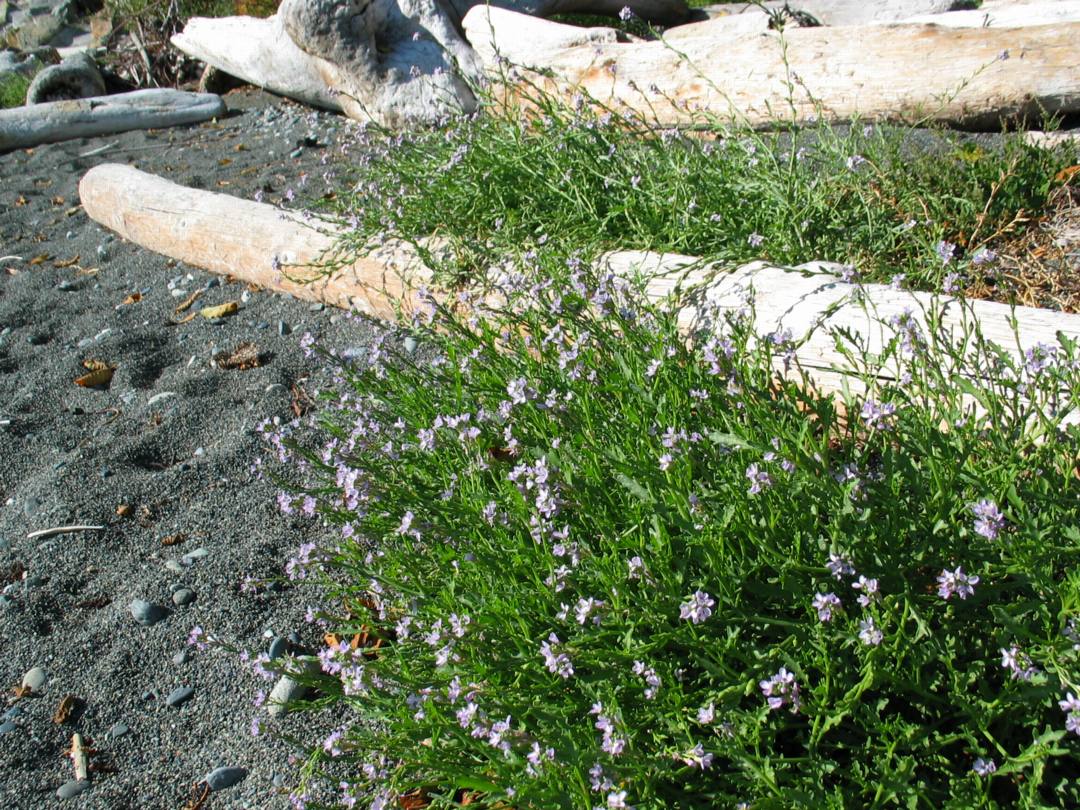
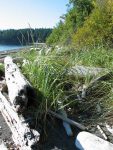
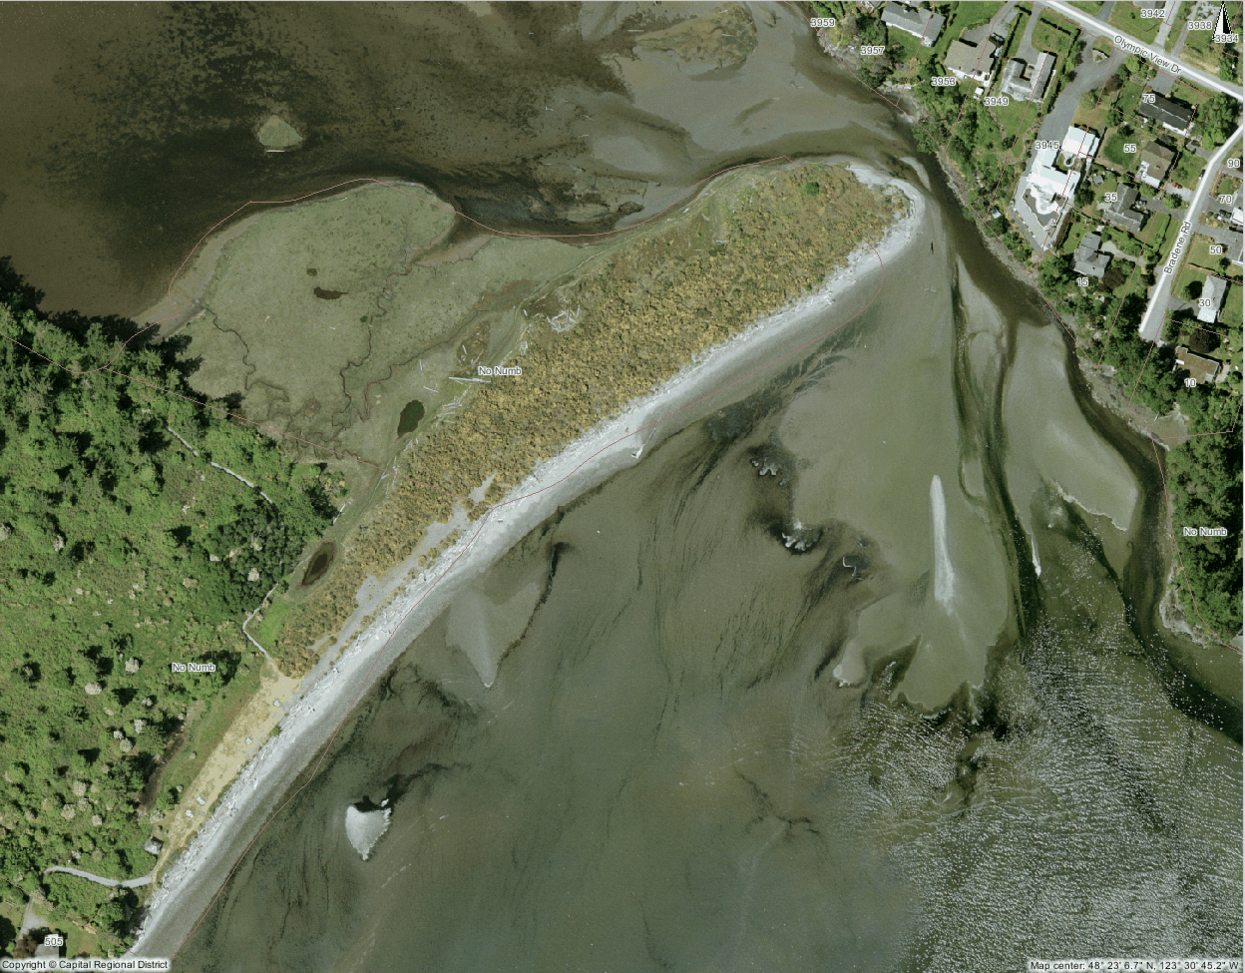 11..Witty’s lagoon/estuary and 10. Beach spit


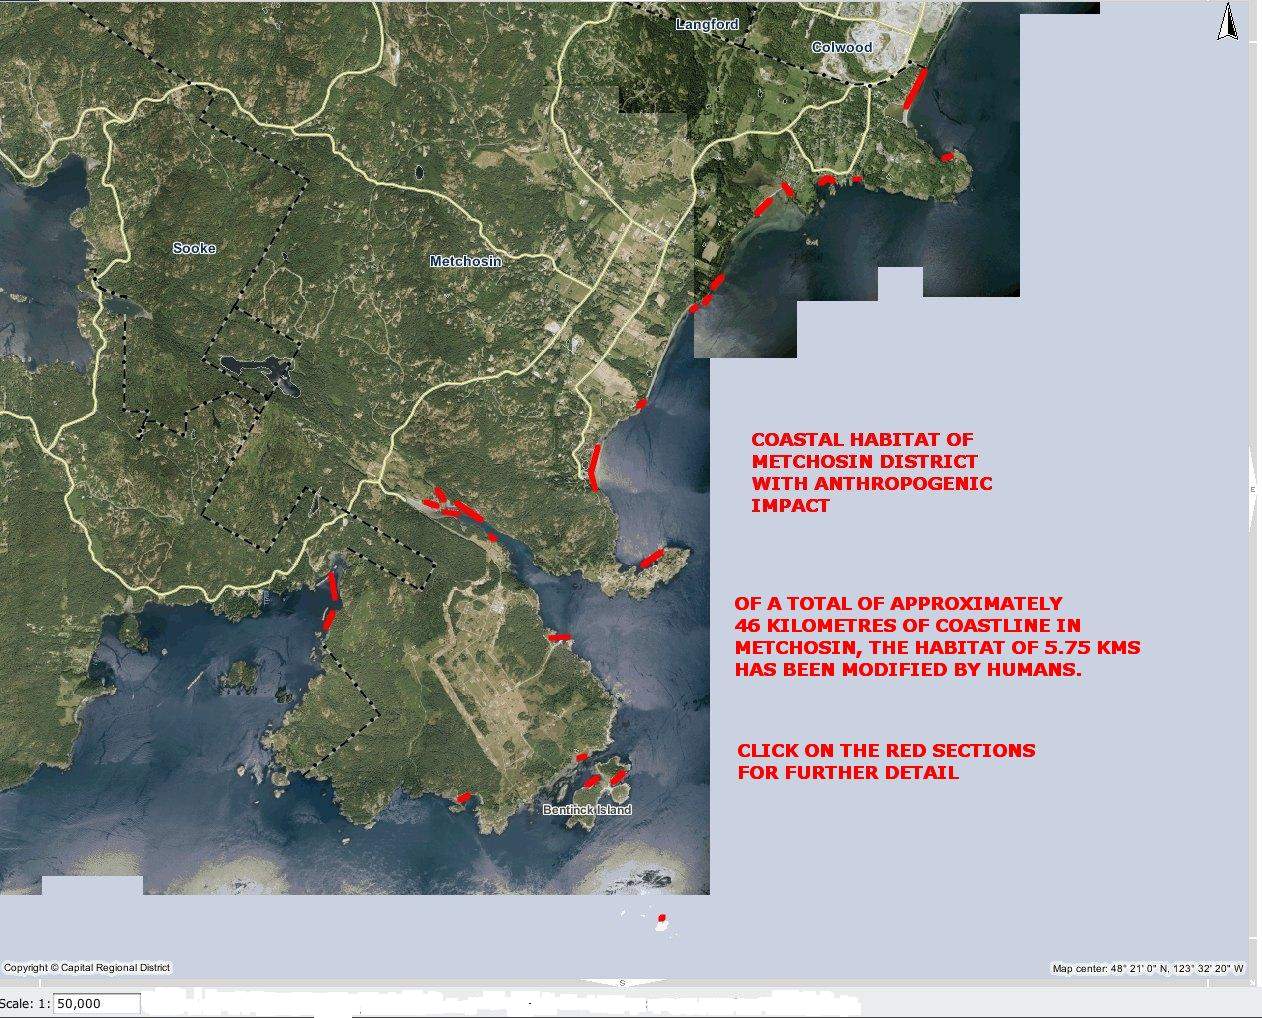
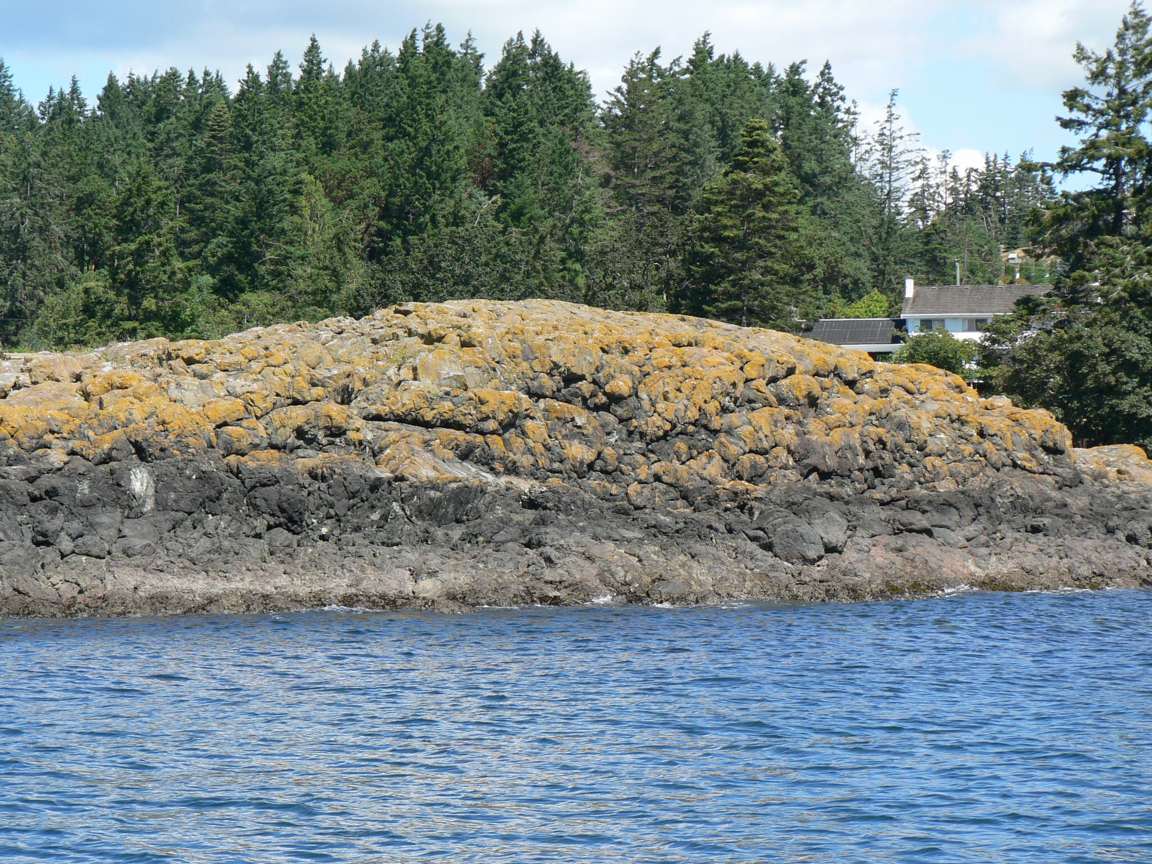
 Link to the Anthropogenic Effects on this area


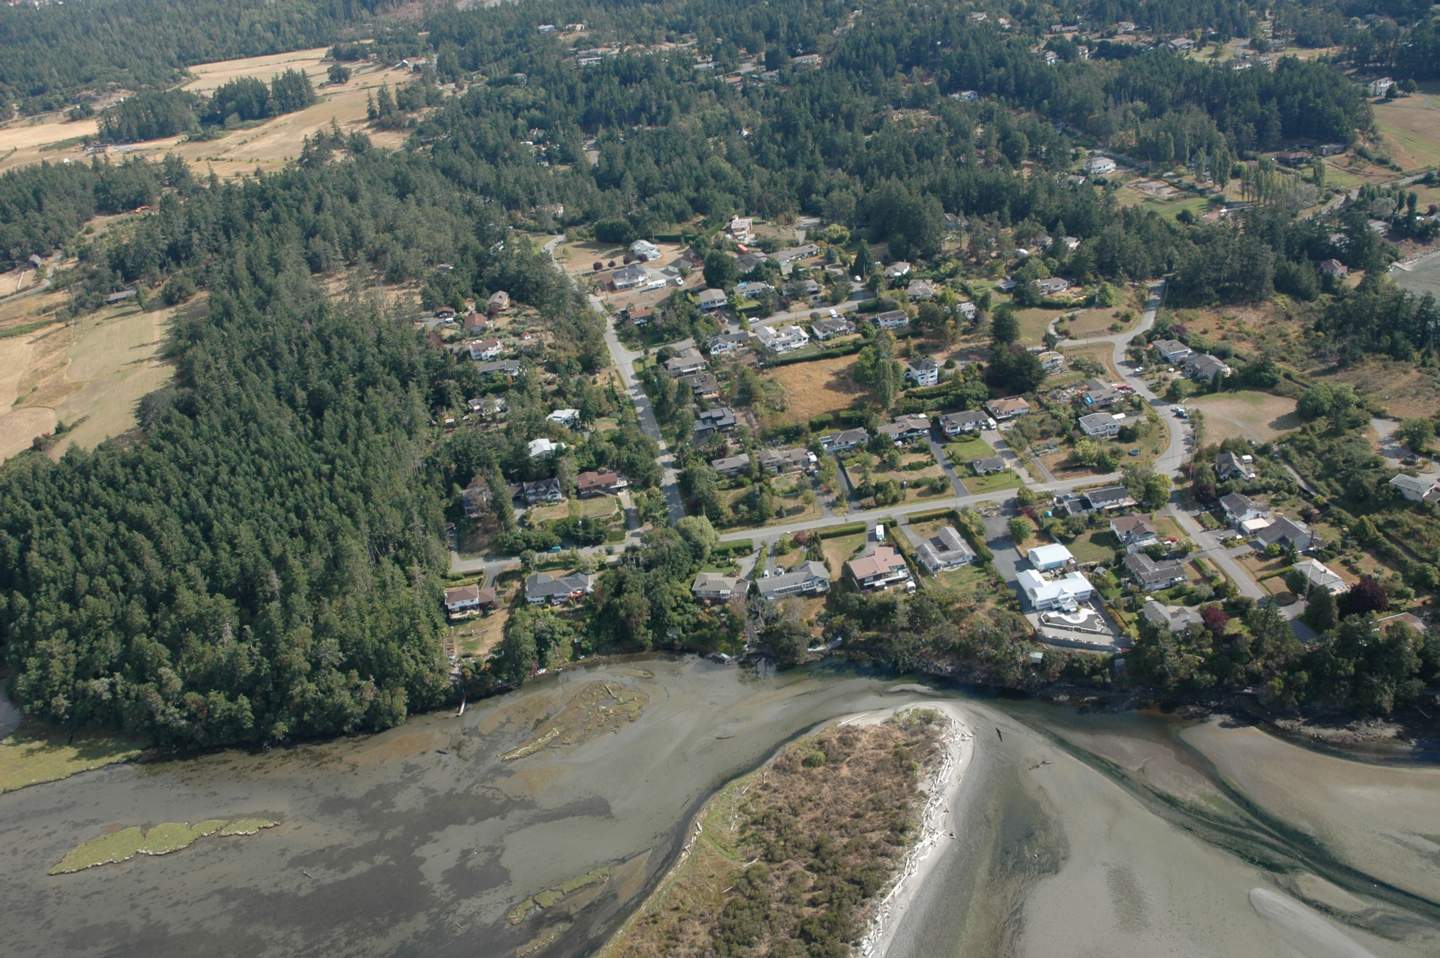
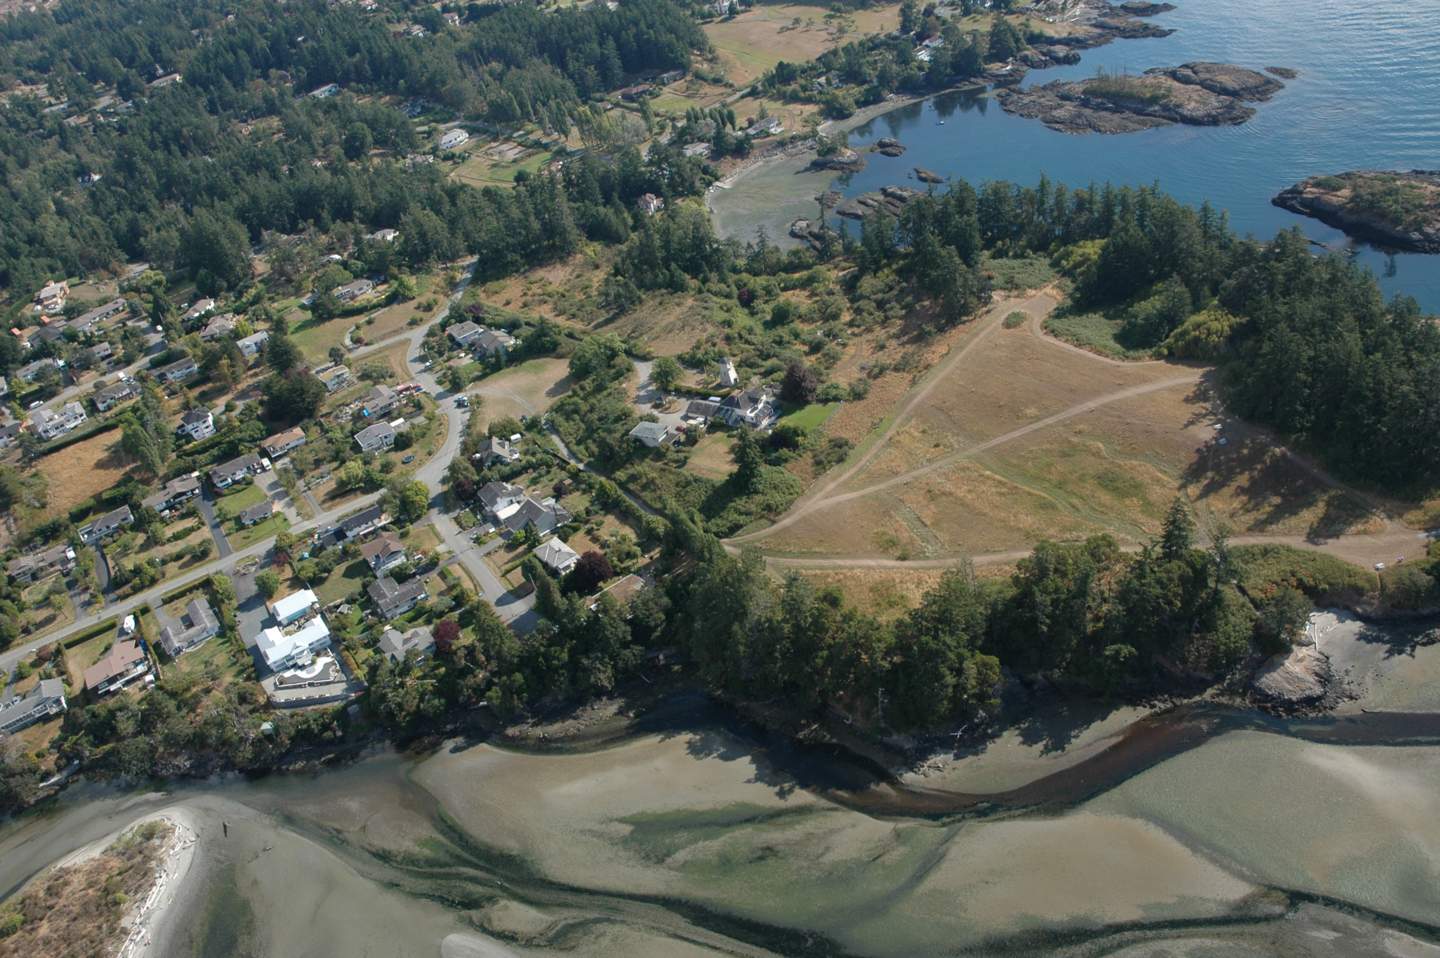
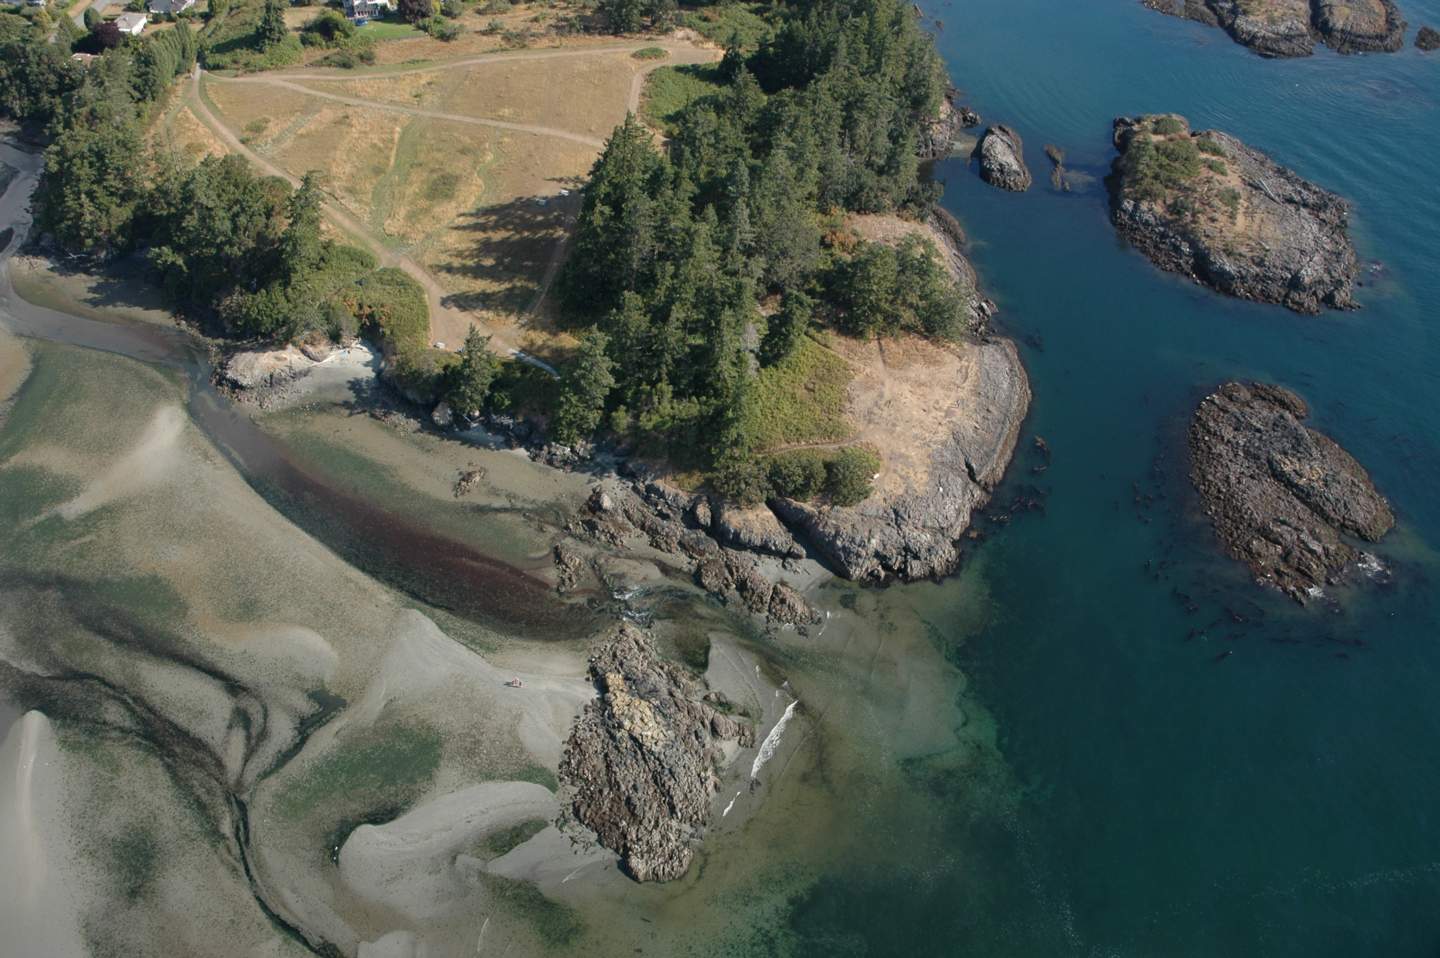
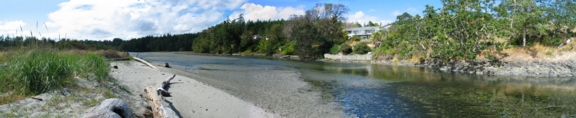
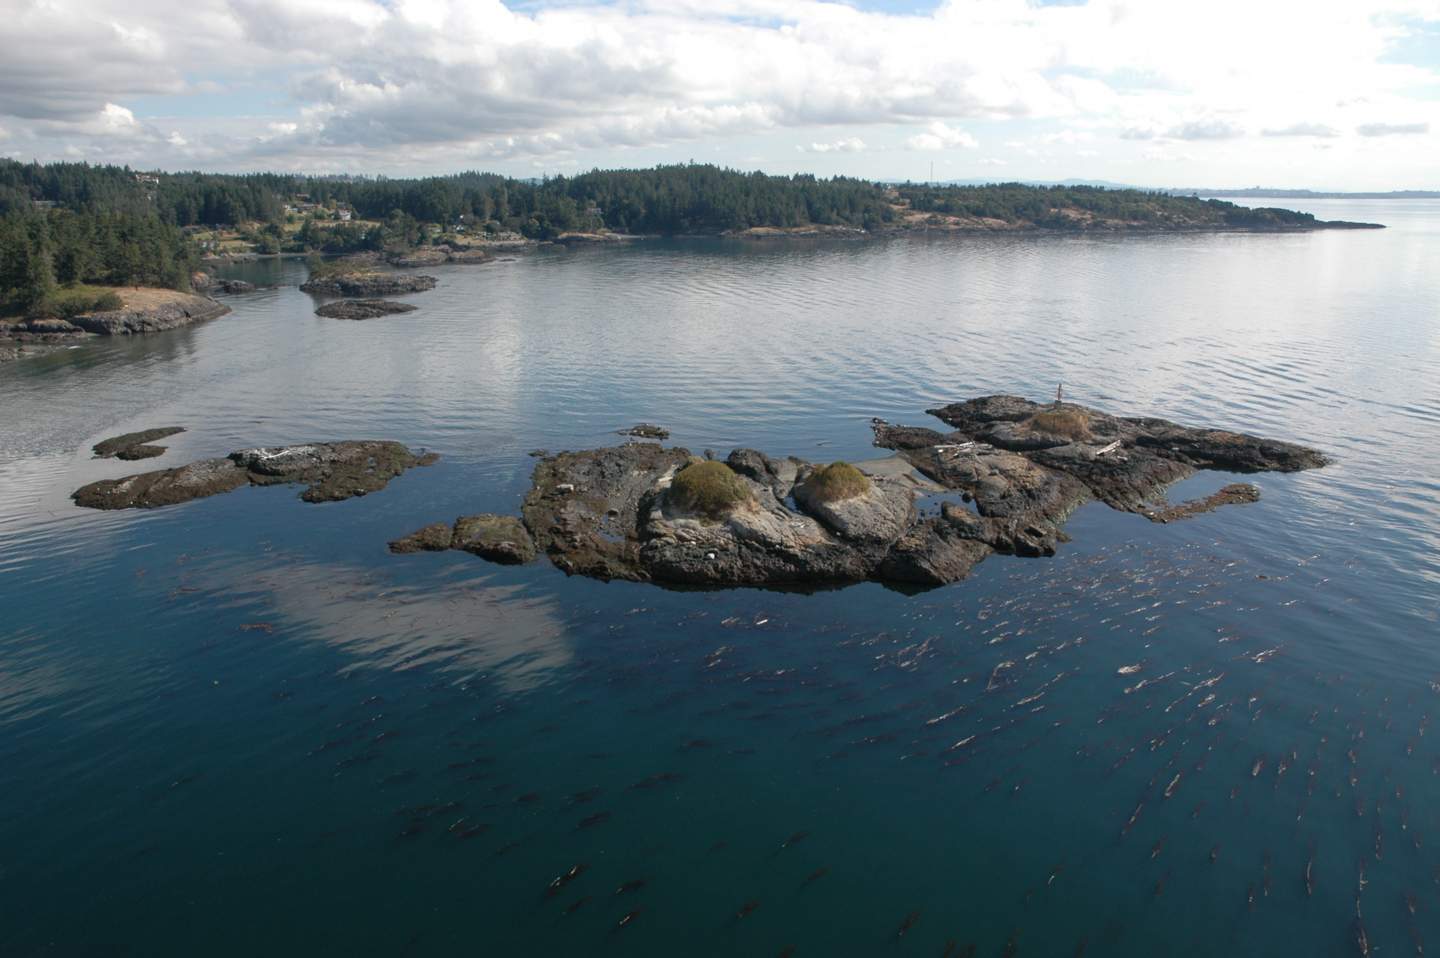
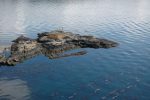

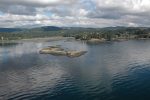

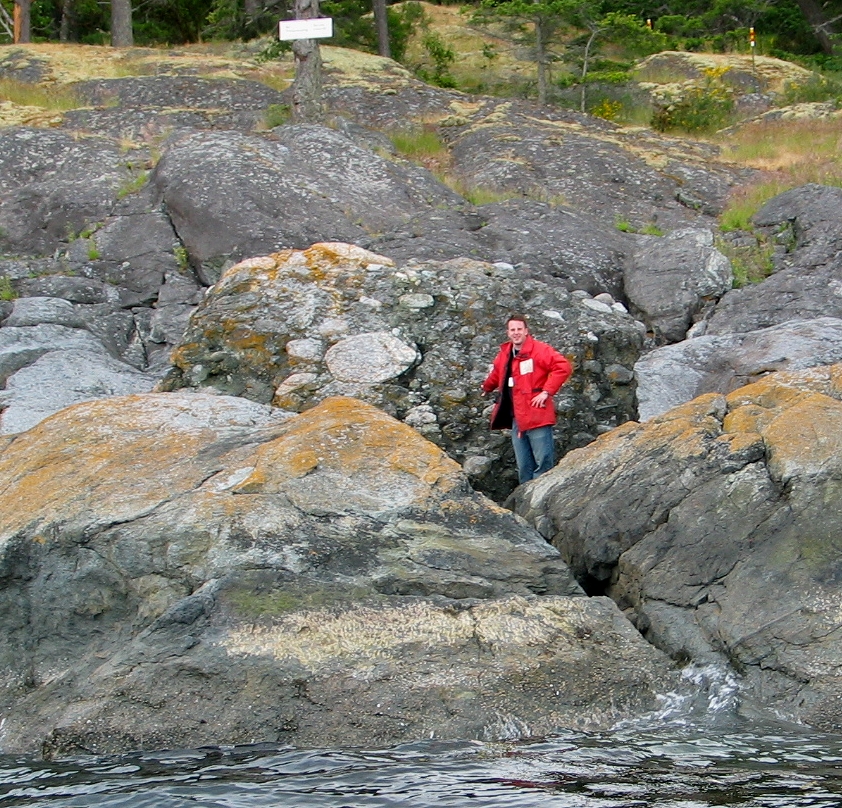
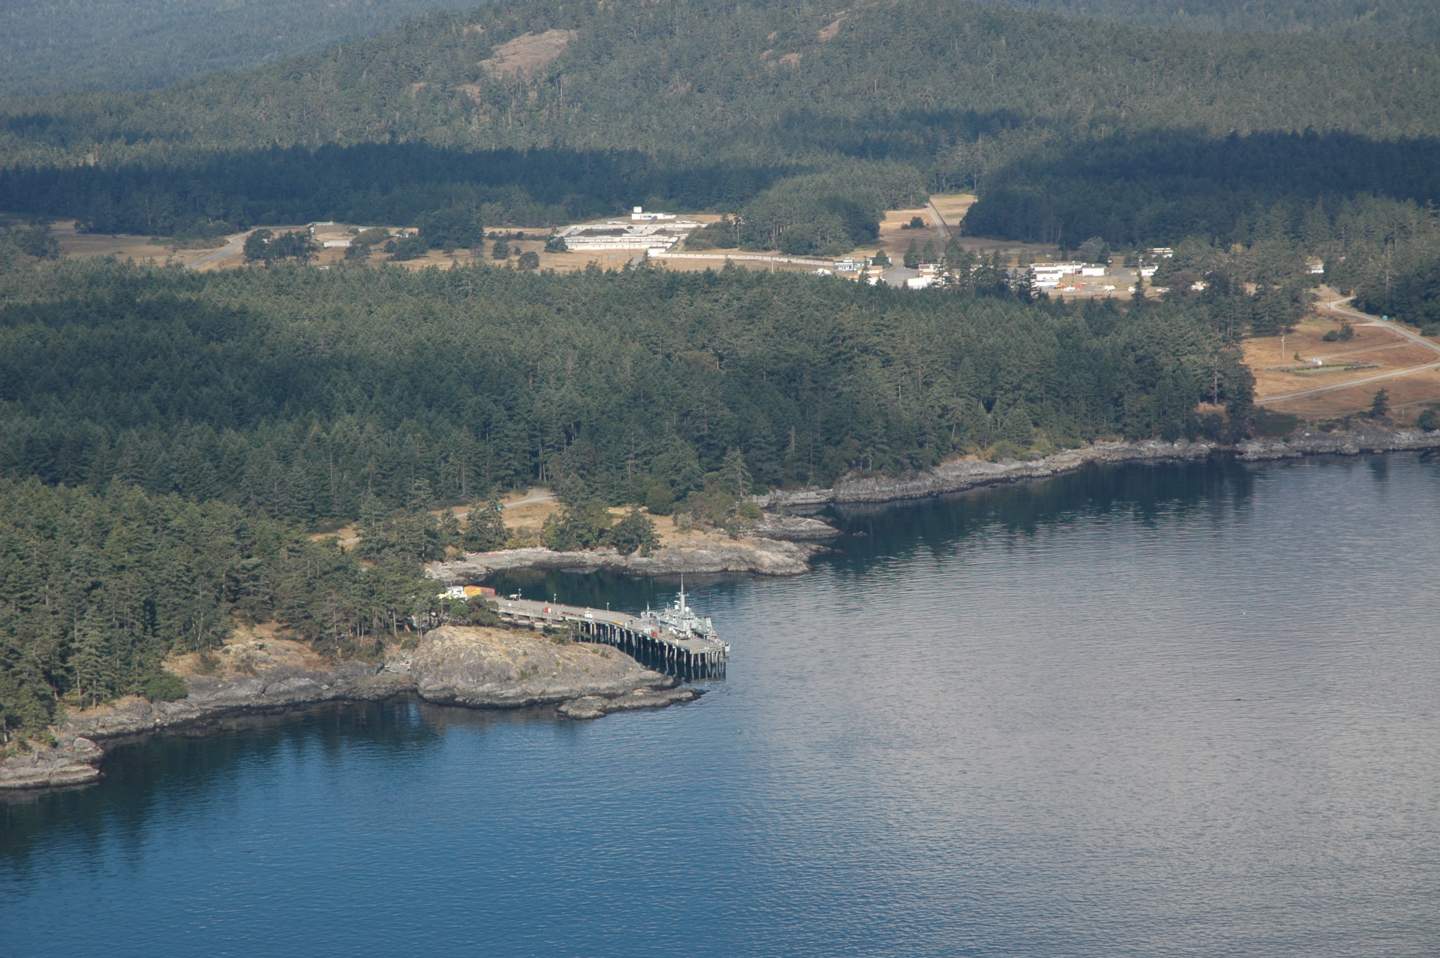
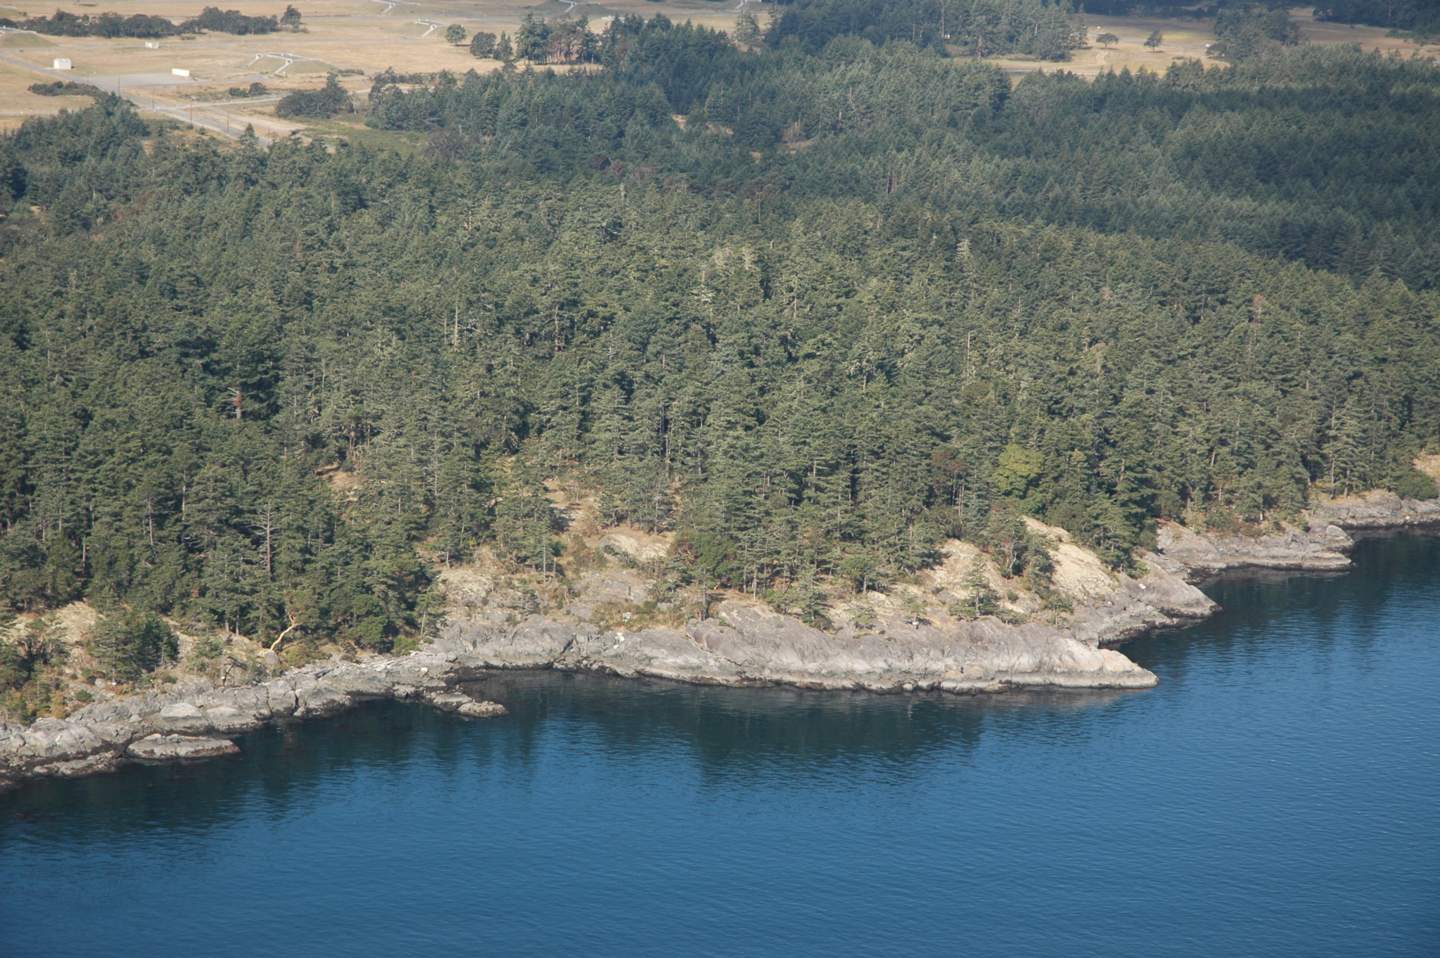
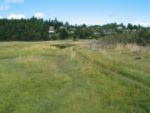
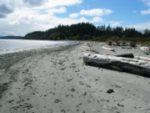
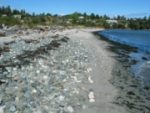
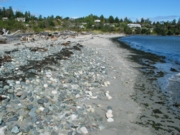
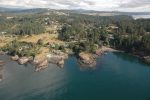
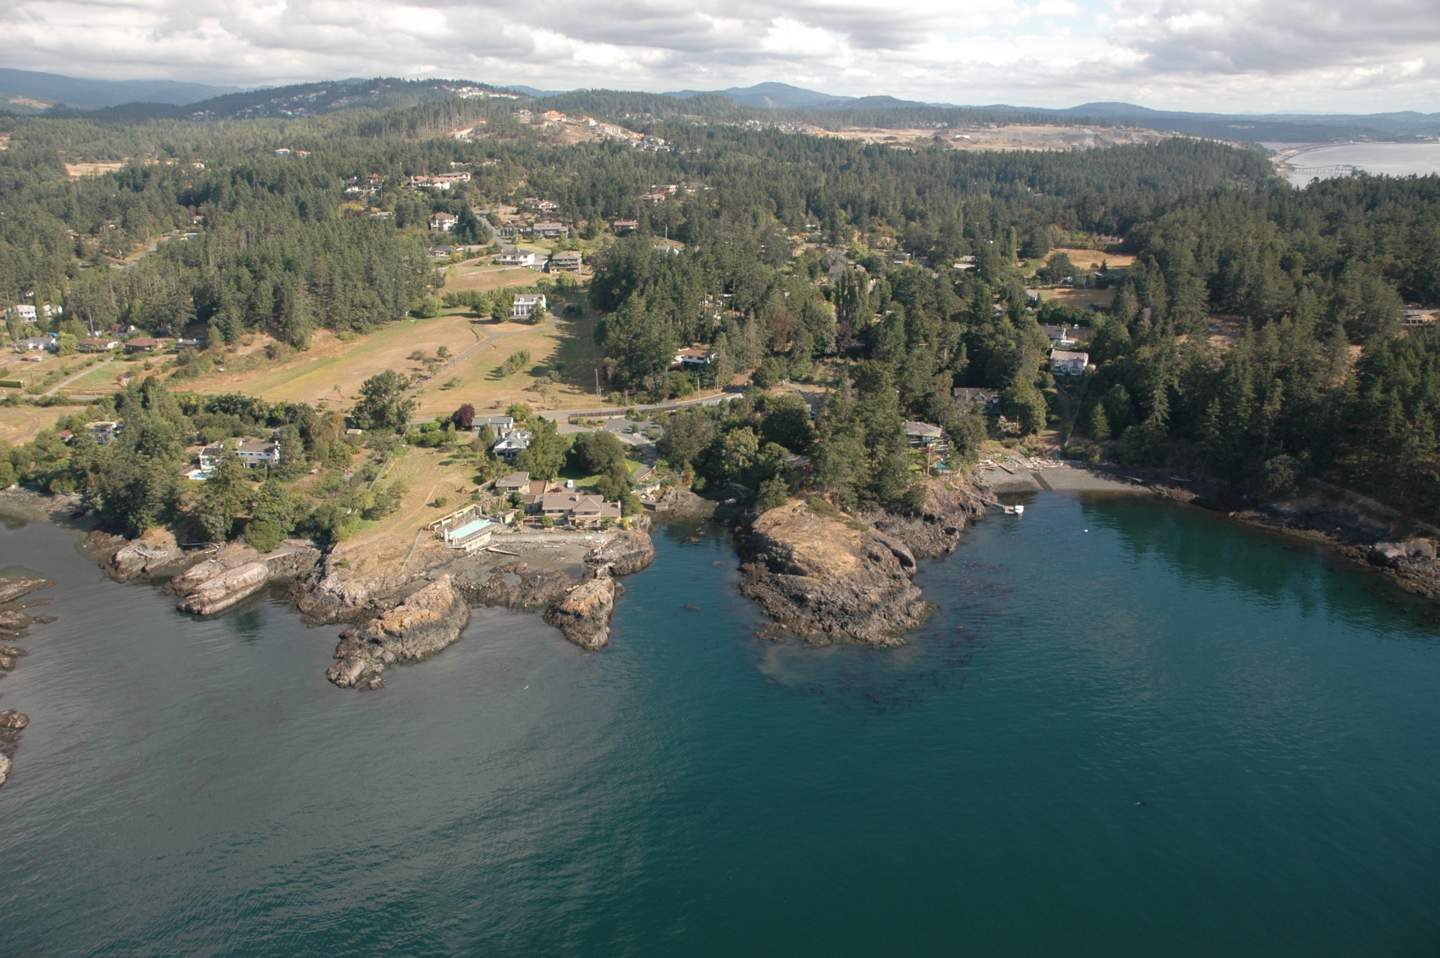
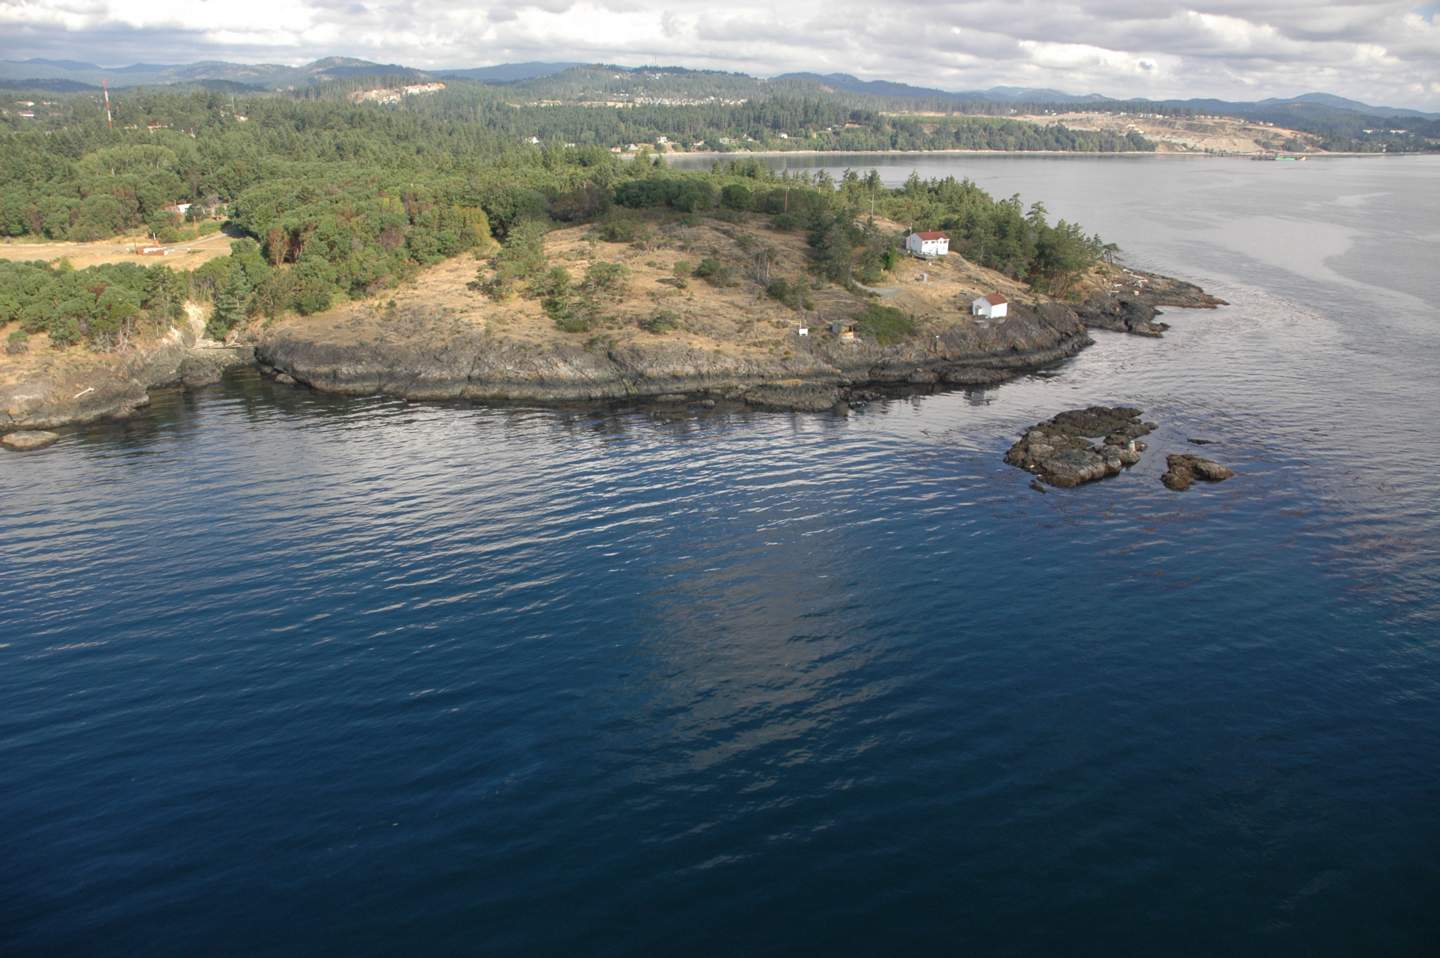
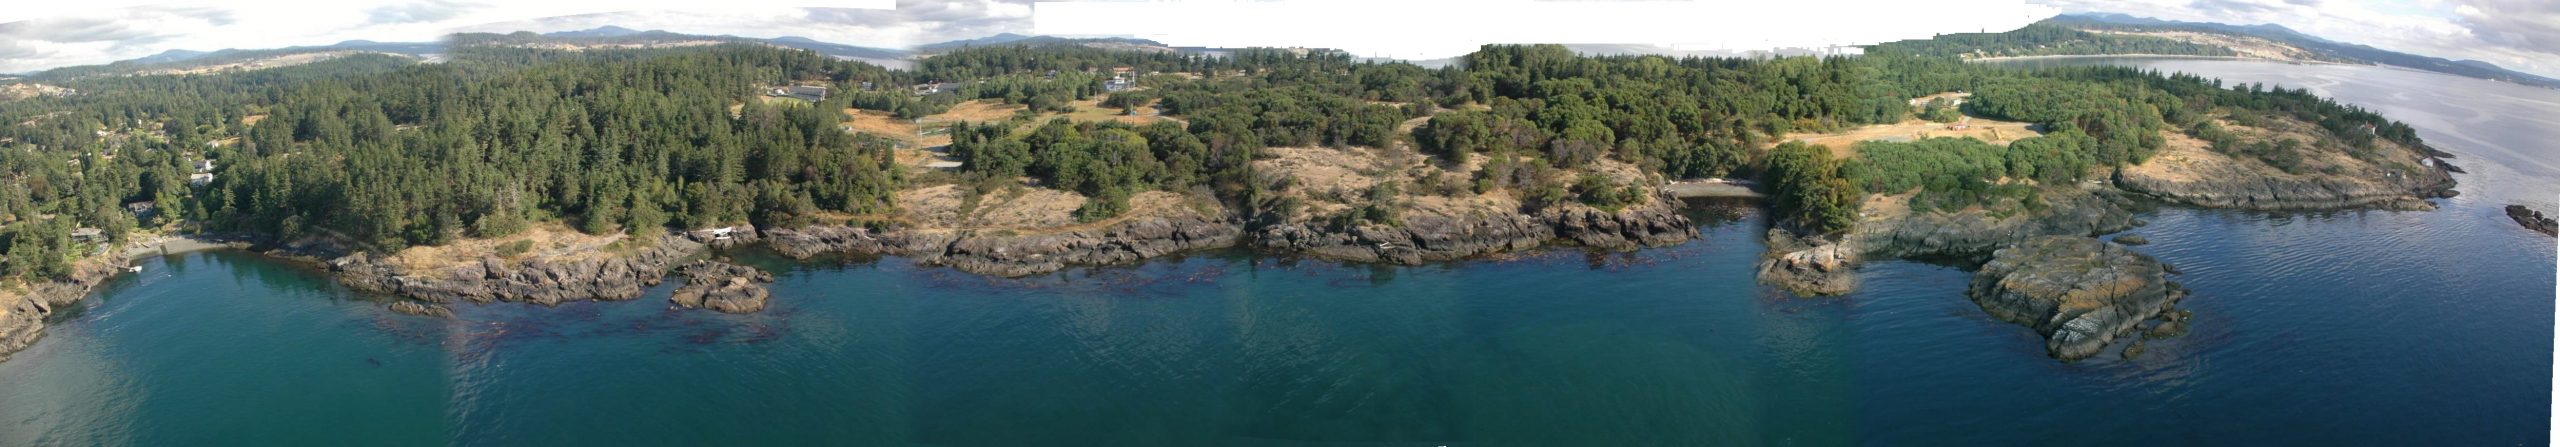
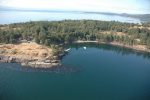
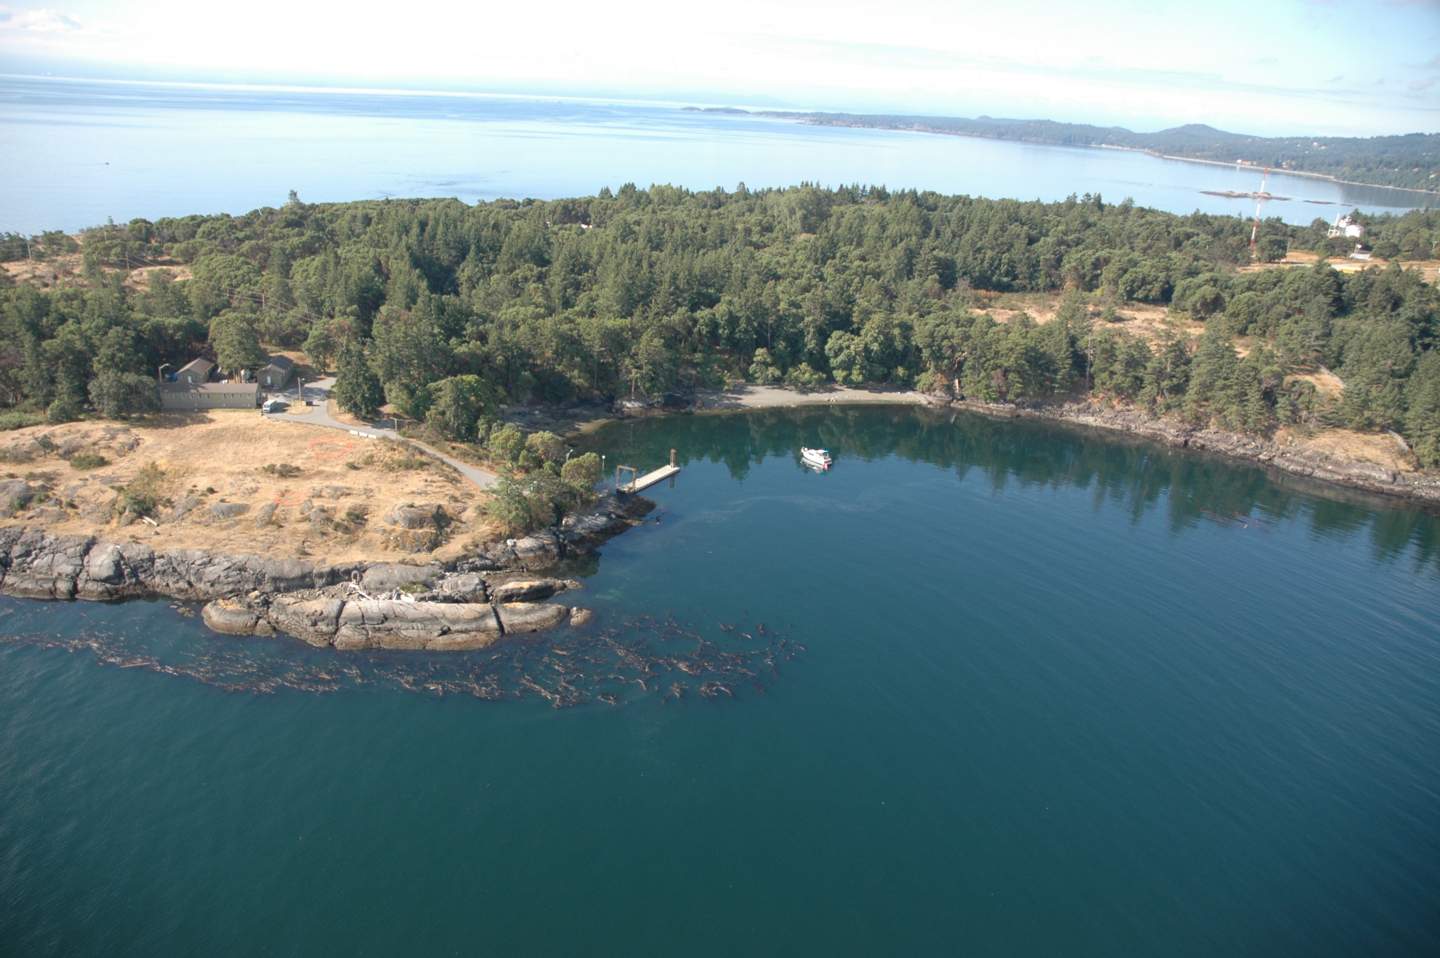
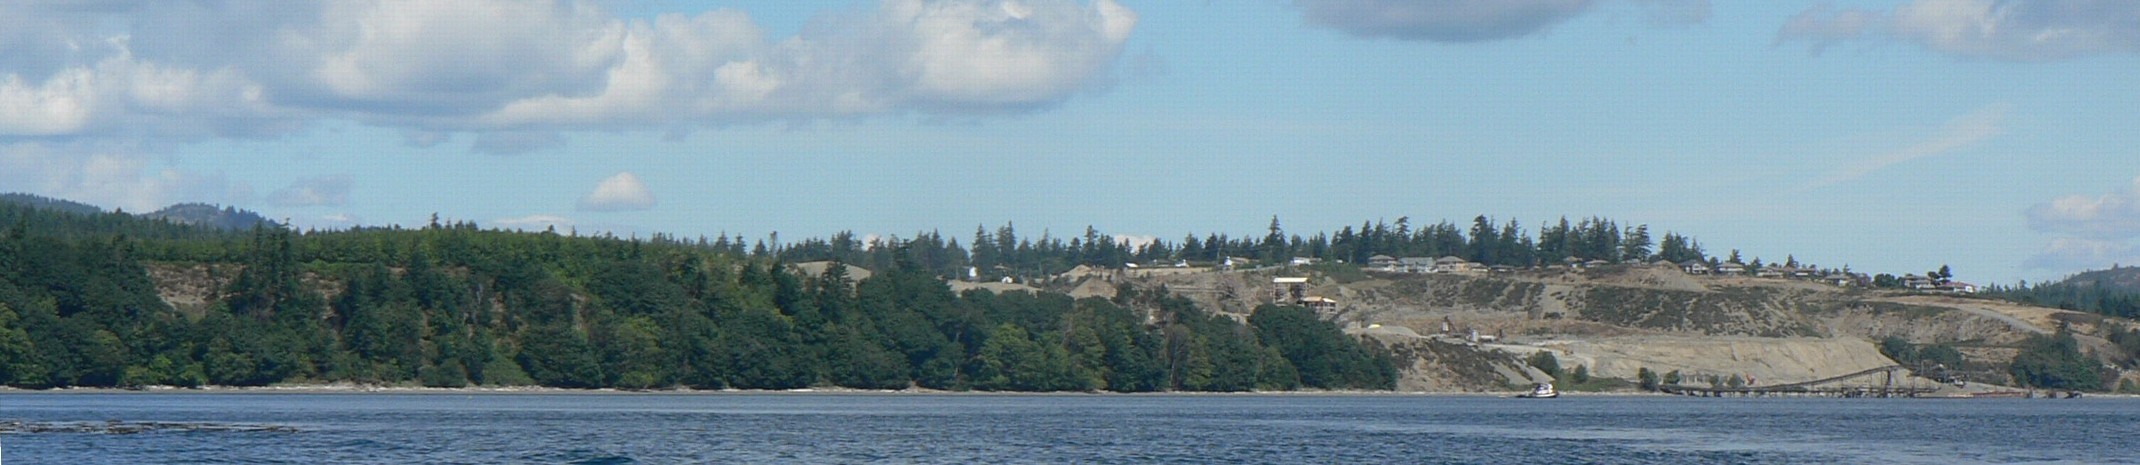
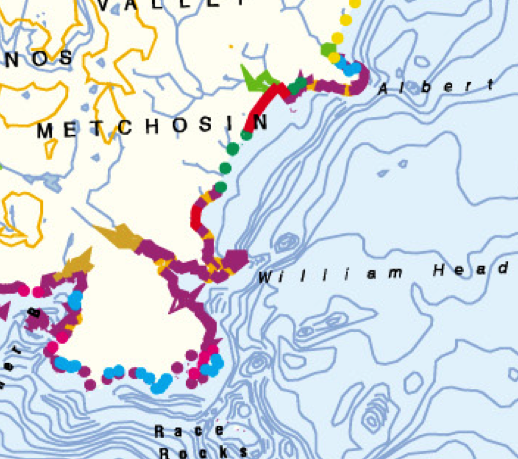
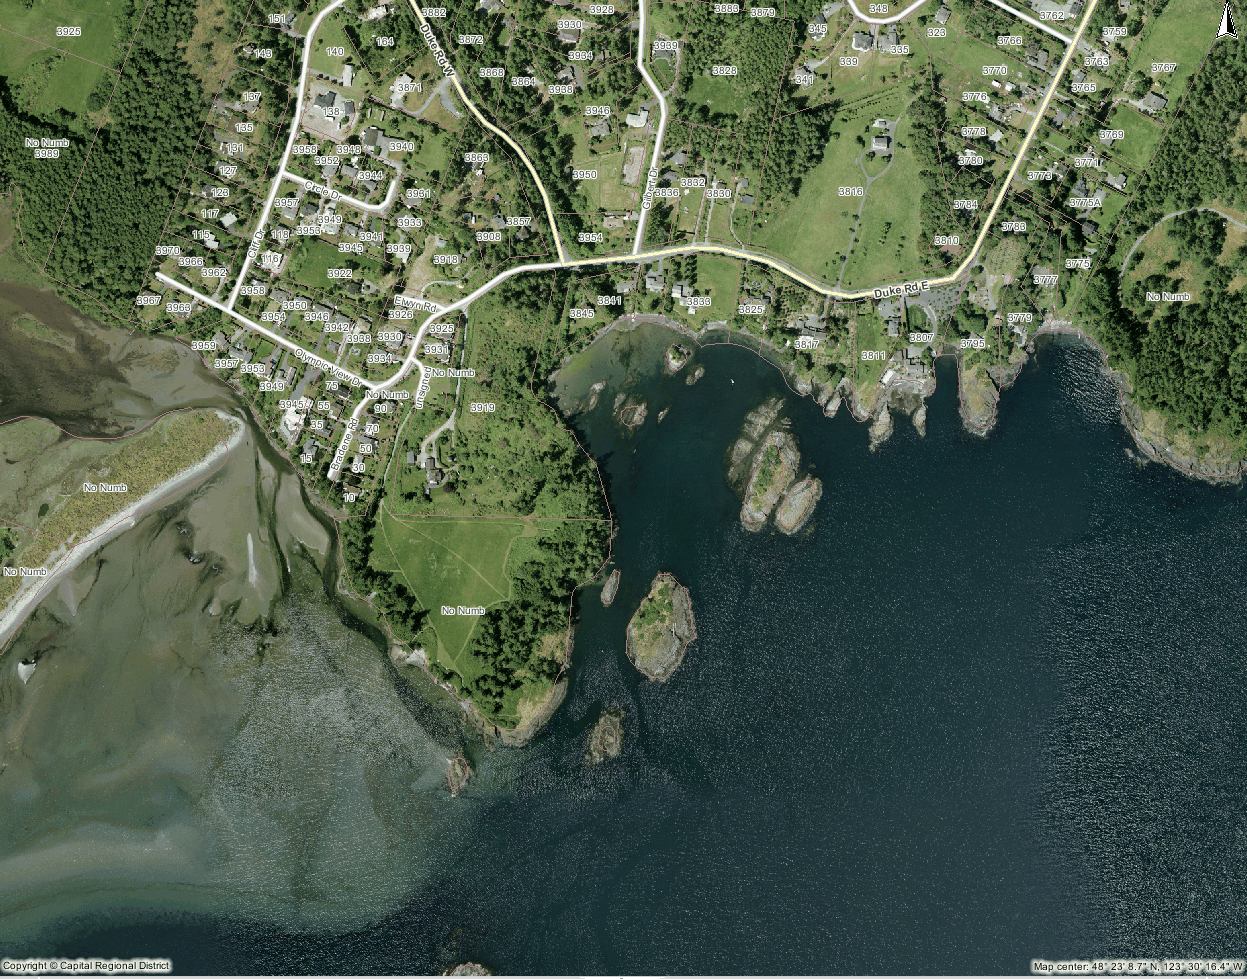 4.5,6,7.. Tower Point and Duke Road Waterfront
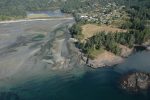


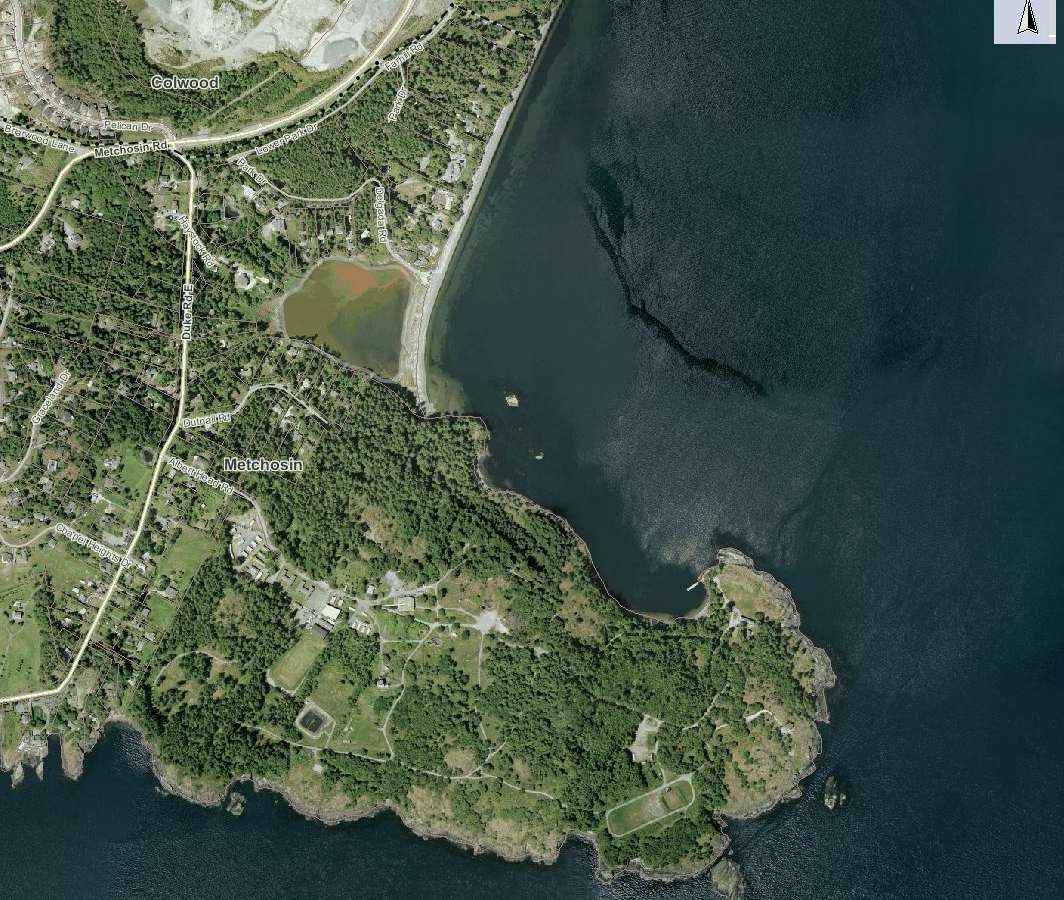
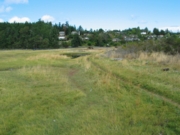
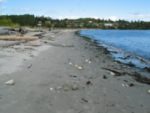
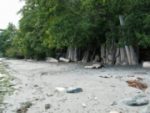
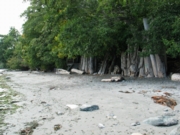
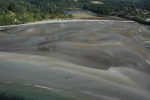
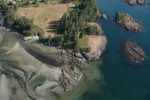
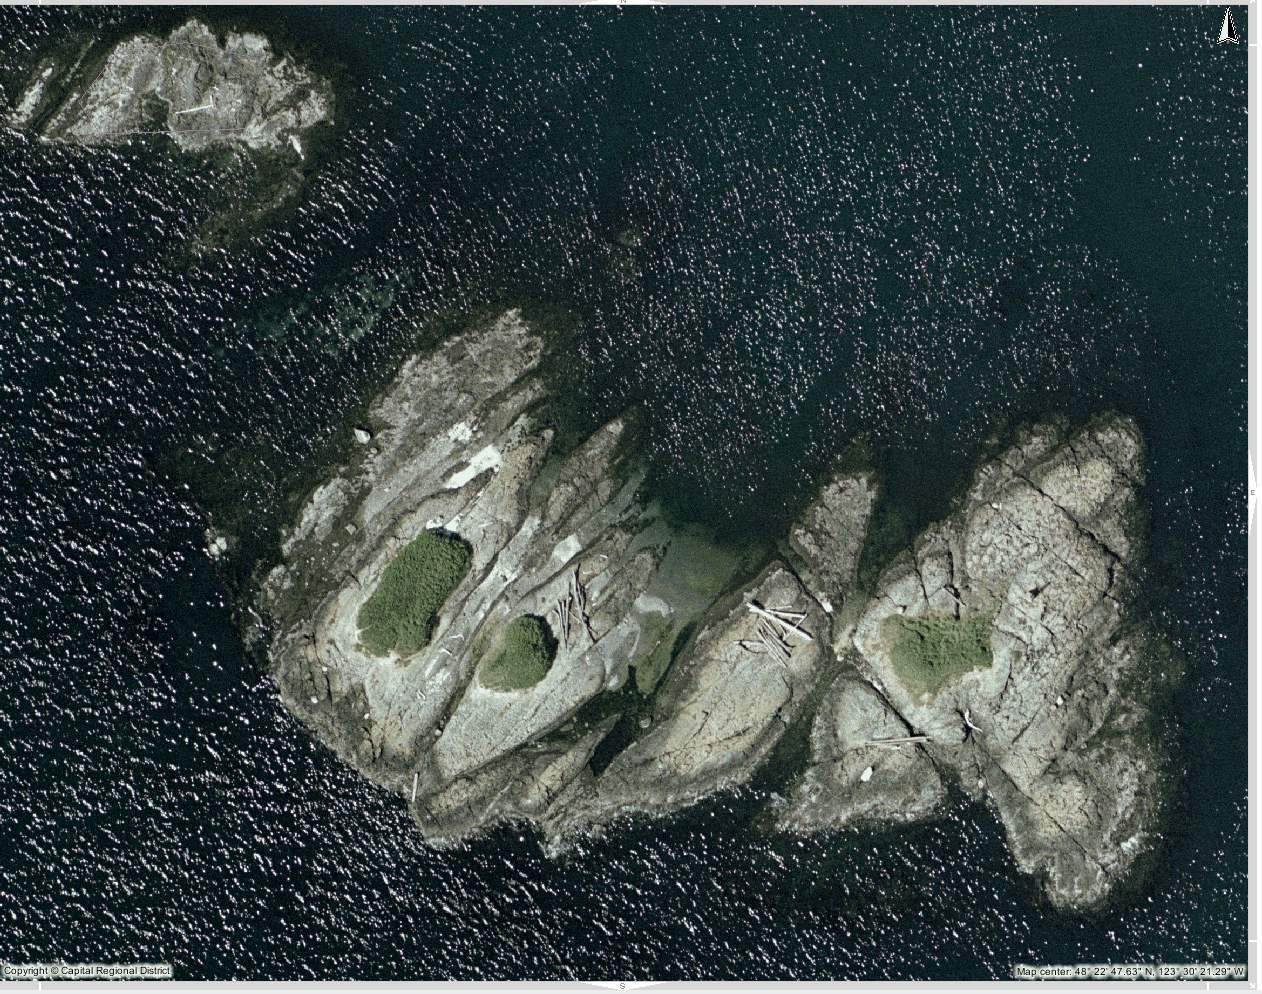
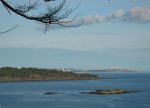
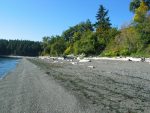
 4,. Albert Head and 2 and 3 North Lagoon and 1.Beach
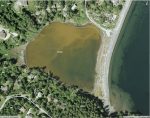


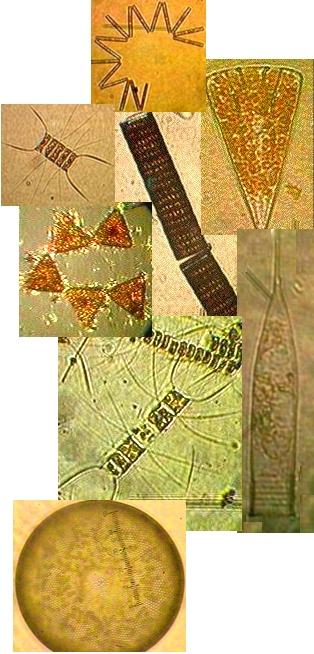
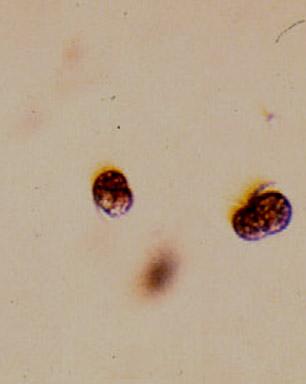
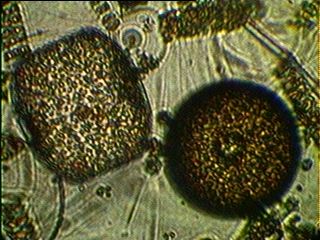
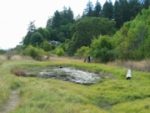
 Often in the spring when the sunlight levels are adequate, the nutrient laden water from winter run-off may support a non-poisonous red tide. A deep reddish bloom caused by the organism Mesodinium rubrum will cover parts of the bay. This is a unique marine photosynthetic ciliate which can fix energy because it has a cryptophyte endosymbiontic red algae inside it. A good example of a mutualistic relationship occurring on a massive scale within the bay.