Hardening of the Shorelines: Principles

The following is from :
Shorelines Modification , by the State of Washington Dept of Ecology

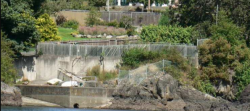
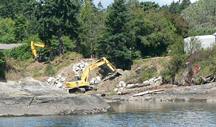
(ii) Principles. Shorelines are by nature unstable, although in varying degrees. Erosion and accretion are natural processes that provide ecological functions and thereby contribute to sustaining the natural resource and ecology of the shoreline. Human use of the shoreline has typically led to hardening of the shoreline for various reasons including reduction of erosion or providing useful space at the shore or providing access to docks and piers. The impacts of hardening any one property may be minimal but cumulatively the impact of this shoreline modification is significant.

Shoreline hardening typically results in adverse impacts to shoreline ecological functions such as:

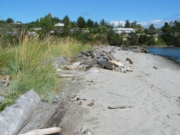
  • Beach starvation. Sediment supply to nearby beaches is cut off, leading to “starvation” of the beaches for the gravel, sand, and other fine-grained materials that typically constitute a beach.
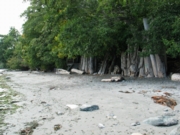
  • Habitat degradation. Vegetation that shades the upper beach or bank is eliminated, thus degrading the value of the shoreline for many ecological functions, including spawning habitat for salmonids and forage fish.
  • Sediment impoundment. As a result of shoreline hardening, the sources of sediment on beaches (eroding “feeder” bluffs) are progressively lost and longshore transport is diminished. This leads to lowering of down-drift beaches, the narrowing of the high tide beach, and the coarsening of beach sediment. As beaches become more coarse, less prey for juvenile fish is produced. Sediment starvation may lead to accelerated erosion in down-drift areas.
  • Exacerbation of erosion. The hard face of shoreline armoring, particularly concrete bulkheads, reflects wave energy back onto the beach, exacerbating erosion.
  • Ground water impacts. Erosion control structures often raise the water table on the landward side, which leads to higher pore pressures in the beach itself. In some cases, this may lead to accelerated erosion of sand-sized material from the beach.
  • Hydraulic impacts. Shoreline armoring generally increases the reflectivity of the shoreline and redirects wave energy back onto the beach. This leads to scouring and lowering of the beach, to coarsening of the beach, and to ultimate failure of the structure.
  • Loss of shoreline vegetation. Vegetation provides important “softer” erosion control functions. Vegetation is also critical in maintaining ecological functions.
  • Loss of large woody debris. Changed hydraulic regimes and the loss of the high tide beach, along with the prevention of natural erosion of vegetated shorelines, lead to the loss of beached organic material. This material can increase biological diversity, can serve as a stabilizing influence on natural shorelines, and is habitat for many aquatic-based organisms, which are, in turn, important prey for larger organisms.
  • Restriction of channel movement and creation of side channels. Hardened shorelines along rivers slow the movement of channels, which, in turn, prevents the input of larger woody debris, gravels for spawning, and the creation of side channels important for juvenile salmon rearing, and can result in increased floods and scour.

Additionally, hard structures, especially vertical walls, often create conditions that lead to failure of the structure. In time, the substrate of the beach coarsens and scours down to bedrock or a hard clay. The footings of bulkheads are exposed, leading to undermining and failure. This process is exacerbated when the original cause of the erosion and “need” for the bulkhead was from upland water drainage problems. Failed bulkheads and walls adversely impact beach aesthetics, may be a safety or navigational hazard, and may adversely impact shoreline ecological functions.

Hard” structural stabilization measures refer to those with solid, hard surfaces, such as concrete bulkheads, while “soft” structural measures rely on less rigid materials, such as biotechnical vegetation measures or beach enhancement. There is a range of measures varying from soft to hard that include:

  • Vegetation enhancement;
  • Upland drainage control;
  • Biotechnical measures;
  • Beach enhancement;
  • Anchor trees;
  • Gravel placement;
  • Rock revetments;
  • Gabions;
  • Concrete groins;
  • Retaining walls and bluff walls;
  • Bulkheads; and
  • Seawalls.

Generally, the harder the construction measure, the greater the impact on shoreline processes, including sediment transport, geomorphology, and biological functions.
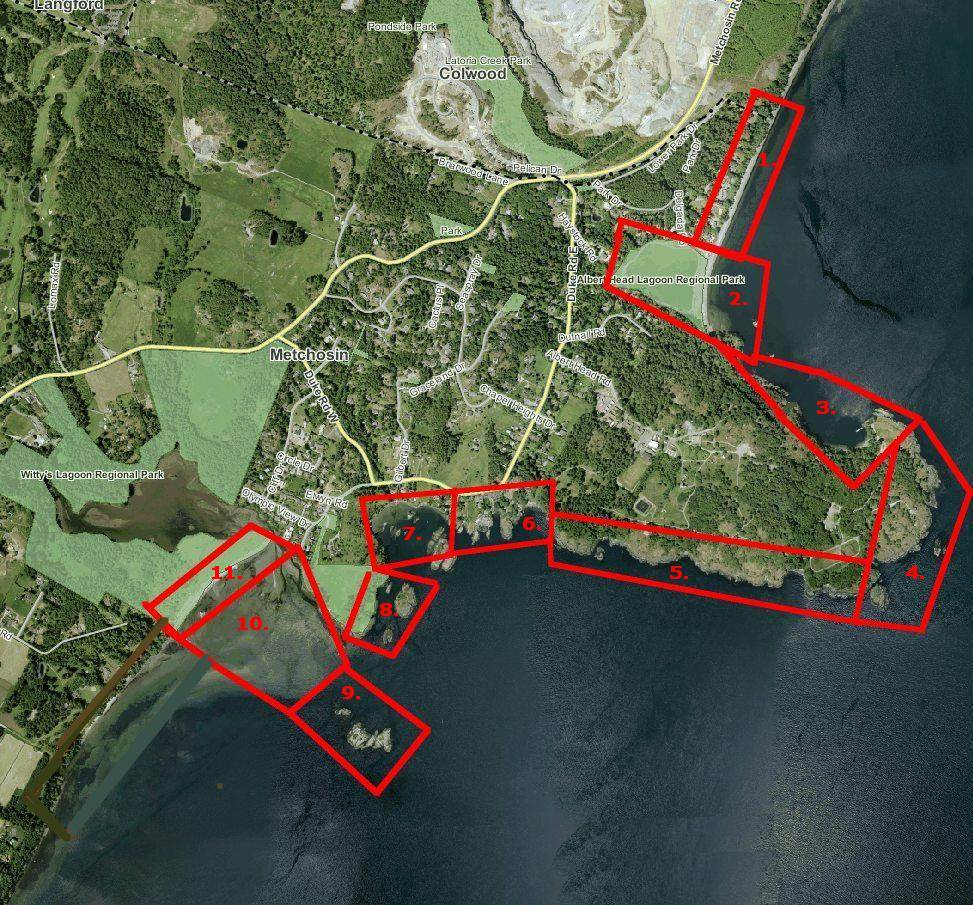
District of Metchosin Official Community Plan Section on Shoreline Slopes Development Permit Areas

From the Official Community Plan : Available at this link

Map6_Development_Permit_Areas

DPAs in Metchosin ( click to enlarge)

2.16    SHORELAND SLOPES DEVELOPMENT PERMIT AREAS:
The Municipal Act
provides that a community plan may designate development areas to be protected from hazardous conditions. The Municipal Act further provides that in such areas land shall not be altered in any way or subdivided and structures not be built or added to until a Development Permit has been  issued. Council has established the following designation, special conditions, and guidelines.

2.16.1    Designation:  (Bylaw 418, 2004)
The 1993 Hazard Land Management Plan has identified areas of the Metchosin shoreland slopes as having erosion, land sloughing and drainage problems.

AlbertHead portion of DPAs

Farhill Road portion of DPAs,

southsectionDPA

Parry Bay ( Taylor Beach ) section of DPA lands

The Shoreland Slopes areas are shown on Map 6 Shoreline Slopes DPA, and are hereby designated as areas for the protection of development from hazardous conditions pursuant to Section 919.1(1)(b) of the Local Government Act.
The Plan has identified three Shoreland Slope classification zones, based on the degree of slope instability and surface erosion potential. Slopes classified as zone 2 and 3 are slopes with the greatest potential for sloughing, slumping and debris flows and have been included in the Development Permit Area.
2.16.2    Special Conditions:
The major concern is that lands, particularly in the Park Drive – Farhill Road area, have experienced a  dramatic rise in ground water levels due to adjacent developments during the last two decades. Other areas of the Shoreland slopes have experienced significant slope erosion in the past. There is a community desire to mitigate any further development related impacts on the marine shorelands.

2.16.3    Policies Development Permits issued shall be in accordance with the following:
(1)    The construction or alteration of buildings on existing lots shall be permitted subject to the Building  Permit process when Council is satisfied that the Development Permit Guidelines (Section 2.14.4) have been met, and, when required, Council is satisfied with the Engineer’s Report (Section 2.14.5).
(2)Where a Development Permit is applied for in conjunction with an application for subdivision approval, rezoning, or both, the Development Permit shall be conditional on the successful completion of those other permits and shall lapse if the subdivision or rezoning is not approved.

2.16.4    Guidelines:
(1)    All applications for new development in the Development Permit Areas shall be required to have an Engineer’s Report (described below).
(2) Removal of vegetation shall be minimized.
(3) House construction, regrading, and excavation of till (including for road building) is not permitted within 60 metres of the edge of the slope except where geotechnical engineering and resource management studies indicate that a lesser setback is acceptable.
page 31

2.16.5    Engineer’s Report:
Before a development permit is issued, the applicant shall be required to furnish a report at his\her expense from a registered professional engineer with geotechnical experience which will certify that the proposed development will produce no adverse impacts on the shoreland slopes and will not place buildings or structures in danger of slope slippage.

The Engineer’s Report shall demonstrate that consideration has been given to the following:
(1)(a) siting and setbacks of development structures, roads, and services,
(b) minimizing paving and impervious materials, and,
(c) implementing infiltration techniques so as to limit runoff;
(2) designing runoff detention ponds, drainage works, or
sediment traps or basins to reduce the flow of  runoff and silt during land clearing and construction.
(3) development near shoreland slopes must address the impact of surface water on slope stability, vegetation and soils, and make recommendations to remedy that already damaged; and
(4) removal of trees (with a valid tree-cutting permit) or other vegetation should be allowed only where  necessary and where alternate vegetation and/or erosion control measures are established. If possible,  stumps should be left in place to provide some soil stabilizing influence until alternative vegetation is  established. Plans delineating extent of vegetation/tree removal (location, species and diameter of trees) and location of proposed construction, ex cavation and/or blasting, may be required.

The DISTRICT, at its discretion, may also submit the Engineer’s Report to review by a second Engineer at the applicant’s expense, and/or directly to the Ministry of Environment for their comments.

2.16.6    Municipal Response, 
The DISTRICT should:
(1) evaluate the feasibility of purchasing environmentally sensitive shorelands for use as park, forest reserve, or greenbelt;
(2) initiate programs to monitor both surface and ground water to establish patterns of change;
(3)work with proximate agencies to establish erosion and land sloughing control measures.

Anything for a View?

Living on a steep coastal bluff with million dollar views may be a dream of many, but with it comes a few responsibilities. The references on development along coastal areas provides many examples of how development has to be done responsibly.  One aspect of concern is vegetation removal and tree cutting and topping on cliffs in order to provide better views to the landowner. In Metchosin, two areas, the Albert Head Cliffs and the Taylor Beach Cliffs provide many examples of this.

In April of 2013 the sound of a chainsaw on the Taylor cliffs led to the discovery of many alder trees on the almost vertical slope that had been topped  and even a few arbutus trees had been cut down.

Topped Alder Trees on the Taylor Beach Cliffs

Topped Alder Trees on the Taylor Beach Cliffs

2013-04-19 aldersectionlThese trees were about 25 years old  as can be seen by the tree rings on chunks of trees that had rolled down to the beach.

It might be pointed out that these trees are from the  area of Metchosin’s Coastline included in the  development permit zone.

This reference from the Center for Ocean Solutions points out he problems of interferring with natural processes on an seaside  cliff given the threats of climate change and sea level rise.

Photo of slope failure from Mail Online

Photo of slope failure from Mail Online

A good example taken from “Mail Online” of what slope failure looked like on Whidbey Island.


perchedoncliffAnd if one still has doubts, check out these images :

CRD Coastal Process

Image

This booklet was written in the 1970’s based on the report done by Dr. Wolf Bauer.

Click on the icon of each page of the gallery to view.


Projected Sea Level Changes for British Columbia in the 21st Century

This federal Govt. report from December 2008 was based on a report by R.E. Thomson, B.D., Bornhold and S. Mazzotti,

“An Examination of the Factors Affecting Relative and Absolute Sea Level in British Columbia”  Canadian Technical Report of Hydrography and Ocean Sciences 260, Fisheries and Oceans Canada (2008); both of these reports are a result of a joint project between Fisheries and Oceans Canada, Natural Resources Canada and the Province of British Columbia.

For the complete document, see:

http://www.env.gov.bc.ca/cas/pdfs/sea-level-changes-08.pdf

Summary

globalsealevelThe 21st century is expected to witness a continued rise in global average sea level as a result of the melting of continental glaciers and ice caps, and warming (expansion) of the upper ocean. At the regional scale, sea level will change in response to these global effects, as well as local effects, including ocean and weather conditions and
vertical movements of the land due to geological processes. Consequently, the expected changes in sea level for the British Columbia coast will differ from the global projections; they will not be uniform. For instance, estimates of most probable sea level rise range from 11 cm at Nanaimo to more than 50 cm in parts of the Fraser River delta. Because of the many uncertainties in measuring past sea level
changes and predicting future sea levels, the possible range could be much greater. Applying a possible, but extreme, global rise rate, sea level could rise 80 cm for Nanaimo and 120 cm for the Fraser River delta by 2100.
The anticipated changes in sea level could have significant consequences for areas currently protected by dikes (such as the Fraser and Squamish deltas), where coastal erosion is already an issue (eastern Graham Island, Haida Gwaii), or where development and harbour infrastructure is close to present high tide limits.
Of particular concern will be extreme weather events, such as storm surges, occurring at the same time as these high sea levels. These extreme events can add as much
as one metre to sea levels, regardless of local shoreline features and waves.

This report summarizes the current scientific knowledge on projected sea level changes as it applies to B.C. during the 21st century to inform decision-making and planning by coastal communities and other authorities. It is a summary of a technical report entitled “An Examination of the Factors Affecting Relative and Absolute Sea Level in Coastal British Columbia” by R.E. Thomson, B.D. Bornhold and S. Mazzotti
(2008) in conjunction with Fisheries and Oceans Canada and Natural Resources Canada.

Sector 7: Taylor Beach, Witty’s Lagoon and Albert Head

Aerial views courtesy of the CRD NATURAL AREAS ATLAS

11..Witty’s lagoon/estuary and 10. Beach spitwittys

Witty’s beach is an accretional beach with materials supplied from long shore drift from the cliffs to the south. Behind the beach is a large tidal lagoon, and estuary fed by Bilston Creek.


Report on Witty’s lagoon (includes Ecology, geology etc. Waterose et al.

Link to the Witty’s lagoon Waterose et.al report


Link to the Anthropogenic Effects on this area


Link to The Wittys Lagoon Estuary and Beach Lab

The following booklet was written in the 1970’s based on the report done by Dr. Wolf Bauer.

A panorama view from the inside of the spit on Witty’s lagoon

A panorama view of the narrow channel for tidal exchange at the end of Witty’s Spit.

4.. Haystock Islands

Haystock Islands show some evidence of human occupation by First Nations in the past.


4.5,6,7.. Tower Point and Duke Road Waterfront
South of Albert Head


  • ** “You can also see excellent exposures of pillow lavas at Tower Point. On the Point and in the sea cliffs of nearby islands, the characteristic feature of the pillow basalts are well displayed in clean outcrops above the high tide line. These dark green, fine-grained rocks commonly contain amygdules filled with quartz and calcite, which appear as white spots up to 1cm in diameter. Several vertical, green vesicular dykes, up to 1 m. wide, trend across the point, and a minor east dipping fault is exposed on the western side of the point. Several outcrops display piles of basalt pillows with flattened bases and shapes that indicate they were squeezed together while the lava was still hot and plastic. You cans see conspicuous light grey to almost white boulders of granodorite, obviously (glacial) erratics, lying on the surface of the pillow basalts.”…..
  • “According to Nick Massey of the BC Geological Survey, the Metchosin Igneous Complex developed as an oceanic island, not unlike Iceland, about 54 million years ago. The pillow basalts exposed here as well as those at the Sooke Potholes… are only part of the complex….Many of the pillows seen in this area contain abundant, round white amygdules, which are commonly arranged in layers close to the margins of the pillows. These amygdules were originally vesicles that have been filled by crystals of calcite and other minerals. Vesicles form when gas, dissolved in molten lava separates from the liquid, causing it to froth. If the pressure of the weight of the overlying water is sufficiently great, the gas does not separate and no vesicles form. Thus there is a rough correlation between the depth below sea level at which the lava erupted and the vesicularity of the lava; with increasing depth, the degree of vesicularity decreases. From this relationship, we can conclude that the pillow basalts of the Metchosin Igneous Complex erupted in moderately deep to shallow water, but not as deep as the present Pacific Ocean Spreading Ridges.”
    2005, Yorath, Chris, The Geology of Southern Vancouver Island, page 114, Harbour Publishing.


5.South Side of Albert Head


4,. Albert Head and 2 and 3 North Lagoon and 1.Beach


To the north of Albert Head Beach and outside of the boundaries of Metchosin District lies the gravel pit which is now in the stages of being close down, to be replaced by a large development .


Anthropogenic habitat modification from Witty’s lagoon to the south side of Albert Head.

Acknowledgements:

Anthropogenic Impacts Albert head lagoon and shoreline

Helicopter aerial views courtesy of GEOBC

The CoastaMetchosin website has been created to represent the contiguous ecosystems of the Race Rocks Ecological Reserve/Marine Protected Area and for the use of the Green Blue Spaces sub committee of the Metchosin Environmental Advisory Select Committee (MEASC). Copyright: G.Fletcher 2013 (garryf ( use at) gmail.com)


Metchosin Marine Issues, an Expression of Concern.

The Unique Value of our Coastal Ecosystems

The Coastal Resources of Metchosin are a valuable form of Natural Capital that must have special consideration when Development Planning is done in the District.   The Crown owns the foreshore to the high tide mark, and although one would think this allowed protection, there are still considerable threats to the ecological integrity of this area, which must be considered. The shoreline is an interface between two systems, the terrestrial uplands and the open ocean. As typical of any natural system, one cannot separate them in terms of management decisions, as they have processes, which interact.   Community members of a progressive coastal community should tolerate no activities involving human action that contribute to any level of destabilization or decline of our present shoreline ecosystems.

Along our shorelines in Metchosin, we have a variety of unique marine ecosystems.

  • Tidal marshes,
  • lagoons,
  • estuaries,
  • bays,
  • eel-grass beds,
  • high speed current channels,
  • underwater caves,
  • vertical underwater cliffs,
  • boulder beaches,
  • sand beaches,
  • and pebble (pocket) beaches.

Every metre of coastal intertidal zone also has a characteristic set of organisms, which can be impacted by actions of humans either from the land side or the ocean side.  Larger commercial species of fish often feed or spawn near the shoreline interface, juvenile fish migrate along shorelines, often relying on protective habitat of overhanging vegetation or kelp beds, and the energy flow in the food webs of at least 7 local marine mammal species are directly affected.

It is further recognized that a viable commercial crab fishery, as well as an extensive sports fishery operates along the coastal areas of Metchosin.

Rockfishconservationareas19_20 The ocean environment in the area of Race Passage has also been recognized as an important habitat for the regeneration of Rockfish stock leading to the creation of a DFO rockfish conservation areas where all fishing is prohibited.


anthroimpactThis file and map of the the Metchosin Shoreline shows the major areas where humans have modified the habitat, often resulting in ecosystem modification and loss of habitat for local species of fish, invertebrates and marine mammals. The term Anthropogenic refers to human modification.


ecoareasThis file contains a map with the ecologically sensitive areas of Metchosin’s Coastal Ecosystems.
Terrestrial Threats:

  • Erosion from road building, utility and sewer installation, subdivision development carrying silt into the receiving waters has a negative impact on filter feeders (e.g. Clams, mussels and anemone) in the ocean.
  • Crushed rock deposited in upland areas in road building and building lot creation may have serious toxic impacts on marine life as water leaches through it carrying dissolved metallic ions to the sea.
  • Accidental or planned deposition of hazardous materials in soils can also lead to leaching to the marine waters.
  • Deforestation on upland slopes leads to deterioration of coastal ecosystems.
  • Channelization of streams leads to silt output and increased fresh water flow to ocean environments.
  • Human traffic, (especially horses) on beaches can severely impact on spawning areas of needle fish (on Taylor beach)
  • Uncontrolled dogs can have a serious impact on feeding patterns of shorebirds- especially crucial during migration.
  • Humans and dogs on beaches can impact on molting elephant seals.
  • Beach debris can be washed seaward, to be ingested by marine animals.
  • Oil and chemicals from storm sewer drains is toxic to marine creatures.
  • Building too close to cliffs can lead to destabilization and therefore slumping of land into the ocean. This is especially of concern along the cliffs of Parry Bay and Albert Head.
  • Sewage disposal on land in septic fields, contributes a large nutrient load as it leaches through to the shoreline. The heavy die-off of algal growth on Weir?s beach annually, is evidence of this.
  • Development on the coastline as has recently occurred South of Devonian Park can lead to alteration of the coastal resource, habitat smothering and destruction, and increases shoreline erosion risk.
  • Backshore alteration of any beach habitat for intended purposes of bank stabilization, inevitably in the long run leads to shorefront habitat deterioration.

Marine Threats:

Tanker traffic very close to our shores, poses a continual risk of oil and chemical spills. In the areas shown in the map, red indicates highly sensitive and a long term residency of oil. Yellow indicates a lesser residence time of oil. Green indicates a faster cleanup may be possible because of exposure to waves and currents. See this reference on Threats from tanker traffic 

  • Increase in cruise lines in recent years has a potential to impact our coastal resources.
  • Increasing fast boat traffic is hazardous to harbour seal pups and slow moving marine mammals (such as elephant seals) in particular.  It also increases rates of coastal erosion in sheltered bays.
  • Boat motor sound underwater affects animals relying on the underwater seascape for communication.
  • whalewiseWhale watching boating patterns have an impact on the time whales can spend foraging in the area.


  • Antifouling compounds on ships (some military) and in boats in marinas provide a further risk to the marine environment

Return to MetchosinCoastal

Originally published by G.Fletcher in 2004.

Pedder Bay, British Columbia Wave Climate Study and Wave Protection Considerations

Pedder Bay, British Columbia-Wave Climate Study and Wave Protection Considerations

Final Report
( THE FIRST FEW PAGES ONLY ARE PRINTED. The COMPLETE VERSION IS AVAILABLE FROM FISHERIES AND OCEANS )

Prepared for: Government of Canada, Fisheries and Oceans

Prepared by: W.F. Baird & Associates Coastal Engineering Ltd.

Ottawa, Ontario

March 1991

TABLE OF CONTENTS

1.0 INTRODUCTION 1
2.0 SITE BATHYMETRY 2
3.0 WATER LEVELS 3
4.0 CURRENT DATA 5
5.0 WIND DATA 6
6.0 WIND-WAVE HINDCAST 11
7.0 PACIFIC OCEAN SWELL 17
8.0 RECORDED WAVE DATA 19
9.0 WAVE CONDITIONS AT THE PROPOSED SITE 20
10.0 SAMPLE BREAKWATER CROSS-SECTIONS 22
11.0 CONCLUSIONS AND RECOMMENDATION 24
REFERENCES

APPENDIX A – WIND DATA SUMMARIES

APPENDIX B – DEEP WATER WAVE HINDCAST SCATTER DIAGRAMS

APPENDIX C – WAVE HINDCAST SCATTER DIAGRAMS FOR THE LOCAL CLIMATE AT THE SITE

APPENDIX D – WAVE DIFFRACTION DIAGRAMS

APPENDIX E – RECORDED WAVE DATA


1.0 INTRODUCTION

The Department of National Defence (D.N.D.) is considering the expansion of the existing facilities and the construction of a new jetty at Canadian Forces Ammunition Depot (CFAD) Rocky Point located on Pedder Bay. British Columbia. Pedder Bay is situated at the southern end of Vancouver Island and is open to the southeast to Juan de Fuca Strait, as shown in Figure 1. 1. Figure 1. 2 shows a closer view of the existing bathymetry and facilities at the site.

The site is directly exposed to waves generated locally within Juan de Fuca Strait, particularly by winds from the east and southeast directions. In addition, the site is also partially subjected to long period swells that propagate through the Juan de Fuca Strait from the Pacific Ocean and diffract around the Rocky Point headlands into Pedder Bay.

The overall objectives of this investigation were to define the wave climate at the proposed site and to complete an initial assessment of wave protection requirements. Specific tasks that were undertaken included:

Assessment of possible wave protection requirements for the proposed harbour.

The results of this investigation are presented in the following sections of this report.

2.0 SITE BATHYMETRY

The water depths within Pedder Bay and the nearby portions of Juan de Fuca Strait is described on a series of charts produced by the Canadian Hydrographic: Service , Fisheries and Oceans Canada,

The underwater topography (bathymetry) within Pedder Bay, as shown in Figure 1.2, is fairly regular with water depths in excess of 20 m at the entrance to the bay. Much of the bay. east of Watt Point, has water depths of approximately 5 to 10 m. Depths along the existing DND jetty range from 6.5 m to 9.5 m according to a 1982 survey by CHS. A small series of shoals and emergent rocks are located on the north side of Pedder Bay directly opposite the jetty. The navigable water is indicated by buoys maintained by the DND.

The bathymetry within Juan de Fuca Strait in the vicinity of Pedder Bay is relatively deep, dropping off to 80 m or greater in a distance of 1000 m from the entrance to the bay. A prominent topographic feature to the south of the bay is an extensive series of shoals called the Race Rocks. These rocks have a direct effect on waves generated from the south and on long period swells propagating down Juan de Fuca Strait.

A hydrographic survey has been carried out in the area east and north of Fossil Point by Klohn Leonoff Ltd. (1990) for DND. An initial comparison of the results of this survey with previous surveys shows little change to the bathymetry in this area.


3.0 WATER LEVELS

Water level recorders near Pedder Bay have been located at Victoria and at Sooke Harbors. The Victoria gauge has been operating since 1909 and the Sooke gauge has been partially operational since 1973. Tides In the waters between Vancouver Island and the mainland vary considerably due to the presence of numerous islands and the complex bathymetry of this region. The tides at Sooke are mixed. mainly semi-diurnal (two high and two low waters in one day) while at Victoria the tides are mixed, mainly diurnal (one high and one low water in a day).

The mean water level at Pedder Bay Is estimated by Fisheries and Oceans Canada at 1.8 m above Chart Datum. Table 3.1 represents the tidal heights and extremes for Pedder Bay, Sooke and Victoria.


Table 3.1

Tidal Heights and Extremes

Height Above Chart Datum (metres)RECORDED

HHW LLW Mean LLW Mean HHW Mean Highest Lowest
Pedder Bay 3.3 0.2 2.5 0.6 1.8 N.A. N.A.
Sooke 3.6 0.3 2.8 0.8 1.9 3.8 0.2
Victoria 3.3 0.2 2.5 0.7 1.9 3.7 -0.5

Note: HHW = Higher High Water

LLW = Lower Low Water

Based on the above values, it is recommended that a maximum water level of +3.8 m be utilized for the design of any harbour structures. The mean water level of +1.8 m was utilized for all refraction and diffraction analyses.

Conversations with representatives of CHS have indicated that Geodetic Datum has not been extended to the Pedder Bay area: however, the recent survey by Klohn Leonoff Ltd.

(1990) shows a conversion between Geodetic and Chart Datum. This conversion is given

as: Elevation (Geodetic) = Elevation (Chart Datum) -1.878 m

4.0??CURRENT DATA

The tides flowing into and out of Juan de Fuca Strait create significant currents within the Strait. The magnitude of these currents depends on the size of the tide and may be considerably altered by the meteorological conditions.

Currents were measured four miles south of the Race Rocks in the centre of Juan de Fuca Strait, as shown in Figure 1. 1. On a typical large tide. the maximum tidal currents are approximately 1.5 m/s and 2.0 m/s for the flood (rising) and ebb (falling) tides, respectively.

The peak tidal currents within Pedder Bay Itself are not expected to be large enough. to significantly affect the piloting of vessels into a new facility due to the limited tidal volume contained within the Bay. Currents will, however, have some effect on the refraction of waves into Pedder Bay at certain times, as discussed in Section 6.2.

5